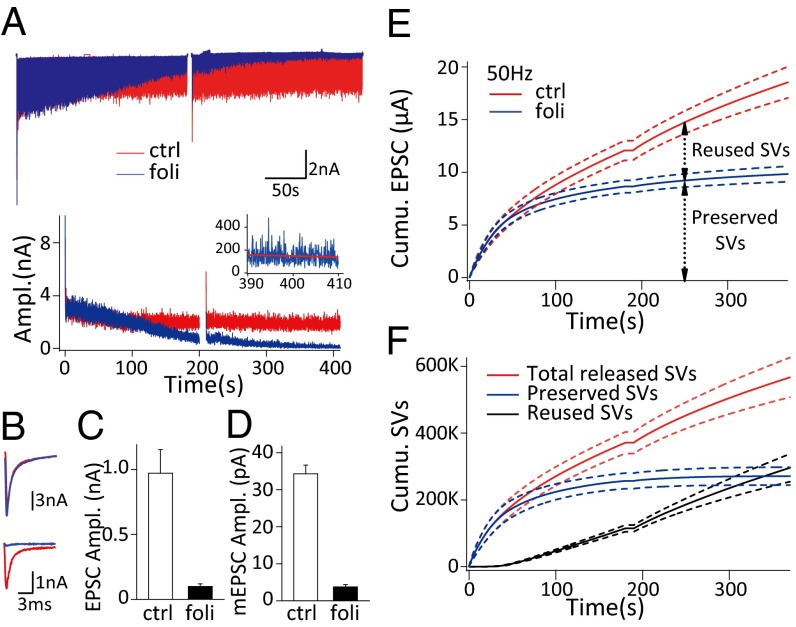
Fig. 1.
Folimycin application reveals the kinetics of synaptic vesicle recycling. (A) Representative EPSCs (Upper) and EPSC amplitudes (Lower) corresponding to 20-Hz stimulation with (blue) and without folimycin (red). (Inset) EPSC amplitudes in the last 20 s of stimulation with folimycin fitted with linear regression (red line). (B) The first (Upper) and last (Lower) EPSCs in A. (C) Statistical comparison of the amplitudes of the last 100 EPSCs before and after folimycin application (n = 8). All of the statistics in the paper denote mean ± SEM. (D) Summary of mEPSC amplitude measured in control and estimated in the folimycin group (n = 8). (E) Pooled cumulative EPSC amplitudes under 50-Hz stimulation (n = 4) with (blue) and without folimycin (red). (F) Calculated cumulative number of total released vesicles (red), preserved vesicles (blue), and reused vesicles (black) under 50-Hz stimulation (n = 4); dashed lines denote mean ± SEM in E and F.

