Fig. 2.
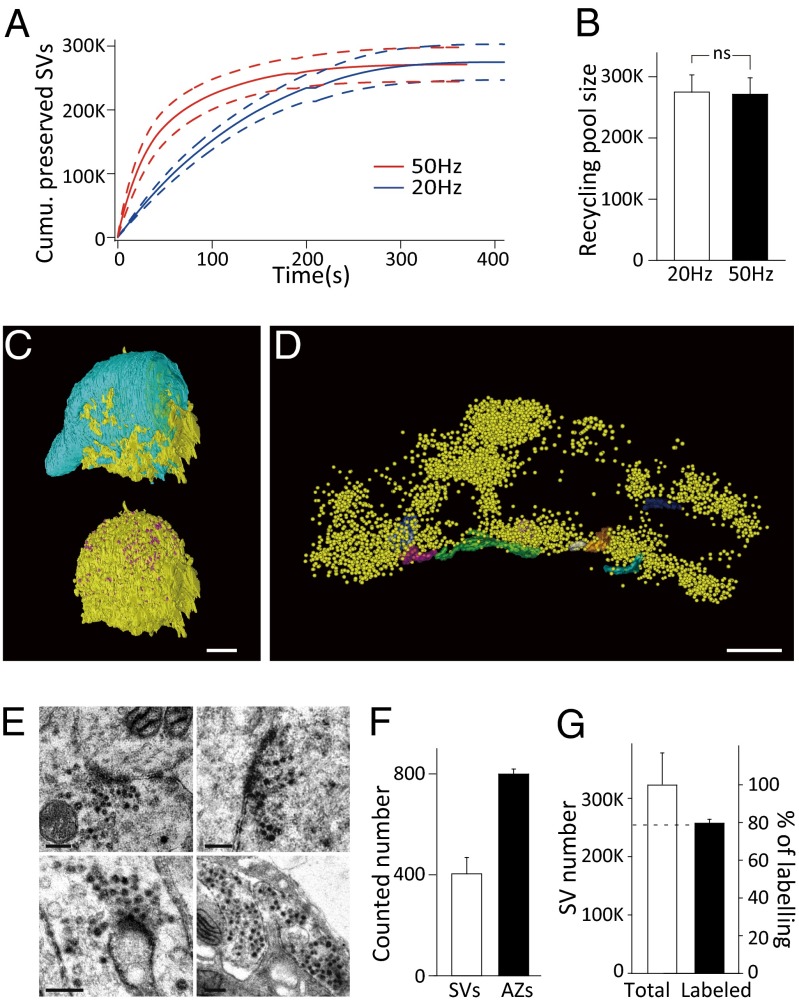
Estimation of total vesicle number and recycling pool size at the calyceal terminal. (A) Kinetics of cumulative preserved SV depletion under 50-Hz (red, n = 4) and 20-Hz stimulation (blue, n = 4); the dashed lines denote mean ± SEM. (B) The estimated recycling pool size derived from the last points in A at 20 Hz and 50 Hz (n = 4). A and B were obtained from electrophysiological measurements. (C) Reconstructed nerve terminal (cyan, Upper), active zones (AZs) (purple, Lower), and postsynaptic principal neuron (soma, yellow) of a calyceal synapse. (Scale bar, 5 μm.) (D) Reconstructed AZs (different colors) and synaptic vesicles (yellow) in a compartment of the calyceal terminal. (Scale bar, 500 nm.) (E) Representative TEM images of FM-labeled nerve terminals. The labeled vesicles appear electron-dense. (Scale bar, 200 nm.) (F) Statistics of vesicle number per AZ (n = 26 AZs from seven cells) and AZ number per terminal (n = 4 cells) counted from 3D reconstructions. (G) Summary of the total vesicle pool size calculated by 3D reconstruction (left coordinate, error bar is the difference of maximum and mean value) and the fraction of FM1-43–labeled vesicles (right coordinate; n = 11 cells).

