Fig. 3.
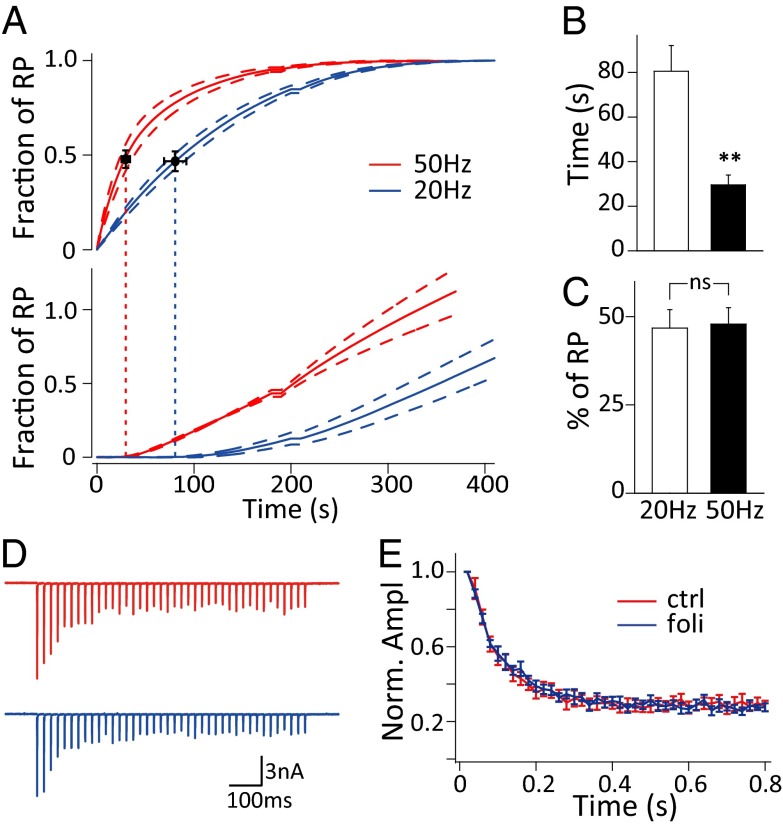
Timing of vesicle reuse under sustained stimulation. (A) Cumulative preserved SV (Upper) and reused SV (Lower) numbers normalized to RP size under 20-Hz (blue, n = 4) and 50-Hz (red, n = 4) stimulation. The dashed lines denote mean ± SEM. The vertical dashed lines indicate the starting time points of vesicle reuse. (B) Statistics of starting time of reuse under 20-Hz (n = 4) and 50-Hz stimulation (n = 4); **P < 0.01, t tests. (C) Statistics of the fraction of RP depletion at the starting time point of reuse under 20 Hz (n = 4) and 50 Hz (n = 4) stimulation. (D) Representative EPSCs and (E) normalized EPSC amplitudes during 40 action potentials under 50-Hz stimulation before (red) and after folimycin application (blue) (n = 11).

