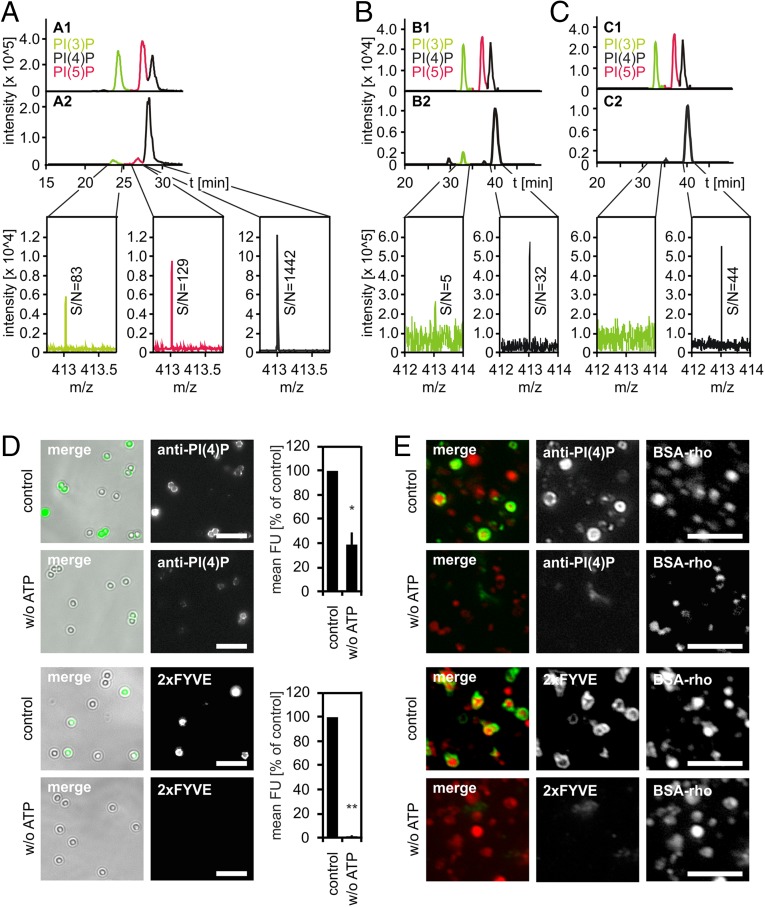
Fig. 2.
Phagolysosomes and lysosomes contain PI(4)P and PI(3)P. LBPs or lysosomes were purified from J774E cells and incubated under fusion assay conditions for 60 min. Compartments were harvested from the reaction mixture by centrifugation, lipids were extracted, deacylated, and analyzed by RP-HPLC-MS. (A) Analysis of deacylated lipids extracted from LBPs. (A1) Extracted-ion chromatogram (EIC) of separation of PIP standards [i.e., PI(3)P, PI(5)P, or PI(4)P)]. (A2) EIC of separation of lipids prepared from purified LBPs and mass spectra of the elution time range of PI(3)P, PI(4)P, or PI(5)P. Signal-to-noise ratios (S/N) are indicated. (B and C) EICs showing separation of PIP standards (B1, C1) or of PIPs prepared from purified lysosomes upon incubation under fusion conditions in the absence (B2) or presence (C2) of WM. (B2 and C2) Mass spectra of the elution time range of PI(3)P or PI(4)P. S/N-ratios are given. (D) LBPs or (E) lysosomes were incubated with PI(3)P-binding 2xFYVE domain or a PI(4)P-binding antibody under fusion conditions in the presence or absence of ATP. Compartments were harvested from reaction mixtures and stained for bound lipid probes. Representative micrographs of LBPs (D) or lysosomes (E). (Scale bars, 5 µm.) (D) Quantification of the amount of lipid probes on individual LBPs. Mean fluorescence intensities (mean FU) from three independent experiments ± SEM, *P < 0.05, **P < 0.01.

