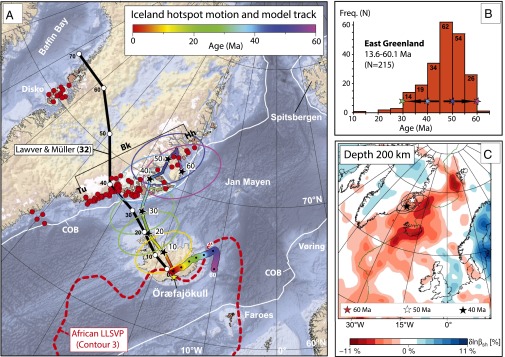
Fig. 6.

(A) Published onshore and offshore Greenland sample locations (red filled circles) for the North Atlantic Igneous Province isotopic age data (updated from ref. 37), and the predicted location of the Iceland plume relative to the Greenland plate (black star symbols; Table 1) shown at 10-My intervals with 95% confidence ellipses. The surface trace of the Iceland hotspot and the location of the Iceland plume relative to the Greenland plate are both shown as a rainbow-colored swath (color-coded according to age). Our model is compared with the classic fixed-hotspot model of Lawver and Müller (32). Our modeled location for the Iceland plume predicts, within the 95% confidence ellipses, that East Greenland was directly affected by volcanism from about 60 to 30 Ma. For the past 60 My, the Iceland plume (and hotspot motion) when projected vertically downward plots on top of the northern margin of the African Large Low Shear-Wave Velocity Province (LLSVP) near the core–mantle boundary (66, 67), and closest to the seismic voting contour 3 (68). COB (white lines) shows the interpreted transition from continental to oceanic crust. Background bathymetry and subglacial topography map is ETOPO1 (50). Brown areas are above sea level, and blue areas are below sea level. Bk, Blosseville Kyst; Hh, Hold with Hope; Tu, Tugtilik-Sulugssut. (B) Histogram showing published isotopic ages from East Greenland (Blosseville Kyst) in 5-My time windows (n = 215 ages). (C) The 200-km depth-slice for the horizontally polarized S-wave velocity (βsh) component of the North Atlantic-Instantaneous Phase model of Rickers et al. (34). A low-velocity layer in the offshore regions extends beneath the continental lithosphere of East Greenland, and notably in the area where we predict the location of the Iceland plume between 60 and 40 Ma.
