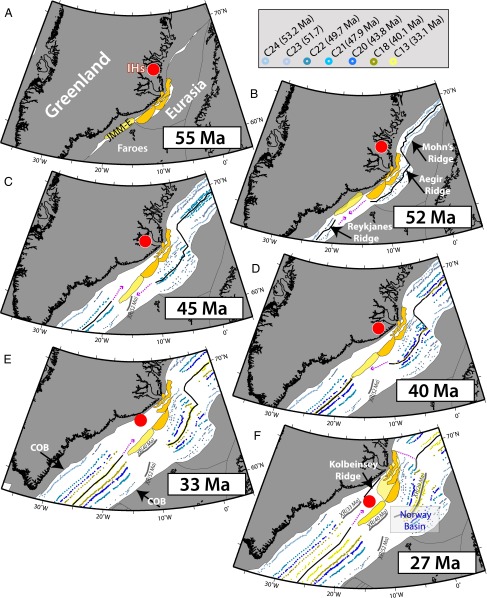
Fig. 7.
Series of plate reconstructions (A–F) from prebreakup (55 Ma) to 27 Ma. Reconstructed magnetic anomaly picks (C24, C23, C22, C21, C20, C18, and C13) are shown by circles of different colors according to age (69). IHs is the reconstructed position of the Iceland hotspot using an absolute plate model (33). Major continental entities are shown in dark gray, and tectonic boundaries within these regions are indicated as thin gray lines. Main tectonic blocks of JMM are shown in orange, and the estimated southward extension is shown in yellow (JMM-E). Plate boundaries based on magnetic data (Fig. 8A) are shown as black lines, and suggested locations of plate boundaries in regions where the magnetic data are ambiguous are shown as dashed magenta lines. Abandoned midocean ridges (XR) are shown as thick gray lines. Light yellow area around the main JMM blocks indicates extended continental crust. COB indicates the transition from continental to oceanic crust.

