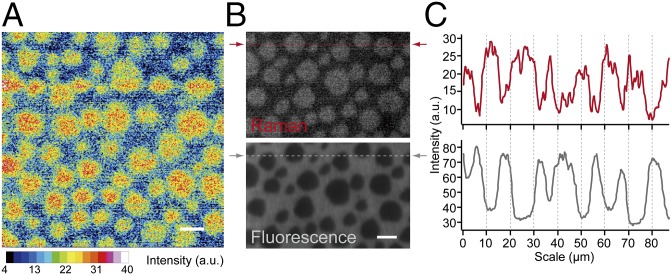
Fig. 5.
(A) High-resolution Raman imaging of a 1:1:1 diyne-SM/DOPC/chol ternary monolayer taken with slit-scanning Raman microscopy. The image was reconstructed using the diyne peak intensity at 2,262 cm−1. Exposure time and laser power were 100 s per line and 10.5 mW/μm2. The image is shown in a 16-color display. The images consist of 412 × 400 pixels. (Scale bar: 10 μm.) (B) Raman and fluorescence images of a 1:1:1 diyne-SM/DOPC/chol ternary monolayer containing 0.2 mol% Bodipy-PC. Raman and fluorescence images were obtained in the same imaging area of the same sample. The Raman image was reconstructed using the diyne peak intensity at 2,264 cm−1. The fluorescence image was reconstructed using the average fluorescence intensity at 542–603 nm. Fluorescence background during Raman imaging was suppressed by photobleaching of Bodipy-PC under 532-nm laser exposure. Exposure time and laser power for Raman imaging were 60 s per line and 14.1 mW/μm2. Exposure time and laser power for fluorescence imaging were 0.5 s per line and 0.3 mW/μm2. Each image consists of 387 × 250 pixels. (Scale bar: 10 μm.) (C) Line profiles of lipid rafts calculated along the dotted lines of the Raman and fluorescence images in B (red and gray, respectively). The line profile from the Raman image was smoothed using the moving average.

