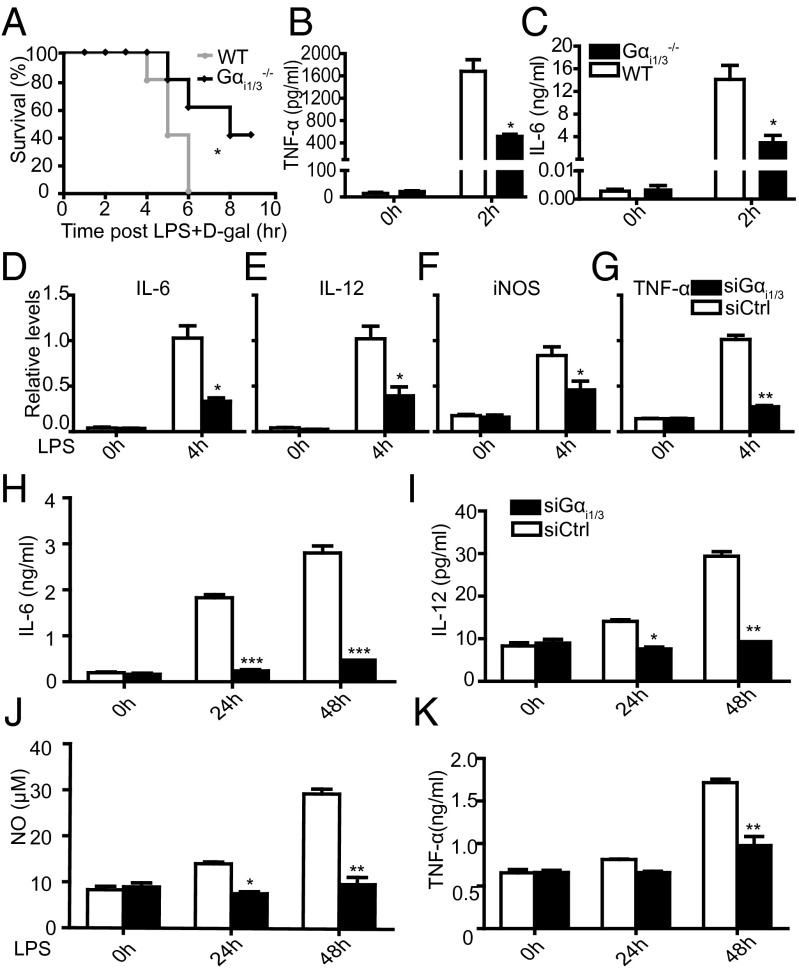
Fig. 1.
Survival of WT and Gαi1/3−/− mice after LPS and d-galactosamine challenge. (A) WT and Gαi1/3 DKO mice were injected i.p. with 4 mg/kg LPS plus 500 mg/kg d-galactosamine. Survival was monitored over 10 h. Keplan–Meler plots were shown after LPS challenge. Statistical significance was determined by log rank test. Data were representative of at least three independent experiments (five mice per group). *P < 0.05. (B and C) Serum assayed for TNF-α (B) and IL-6 (C) by ELISA 2 h after 4 mg/kg LPS plus 500 mg/kg d-galactosamine treatment. *P < 0.05, **P < 0.01. (D–G) BMDMs from WT mice were transfected with control small interference RNA (siCtrl) or Gαi1 and Gαi3-specific siRNA. After 48 h, cells were stimulated with LPS (100 ng/mL) for 4 h. IL-6 (D), IL-12 (E), iNOs (F), and TNF-α (G) mRNA expressions were measured by quantitative real-time RT-PCR (QRT-PCR). *P < 0.05, **P < 0.01. (H–K) BMDMs from WT mice were transfected with control small interfering RNA (siCtrl) or Gαi1 and Gαi3-specific siRNA. After 48 h, cells were stimulated with LPS (100 ng/mL) for 24 and 48 h, and IL-6 (H), IL-12 (I), NO (J), and TNF-α (K) were then measured by ELISA in the supernatants. The results shown are representative of three independent experiments. Data are shown as mean ± SD of three independent experiments. *P < 0.05, **P < 0.01, ***P < 0.001.

