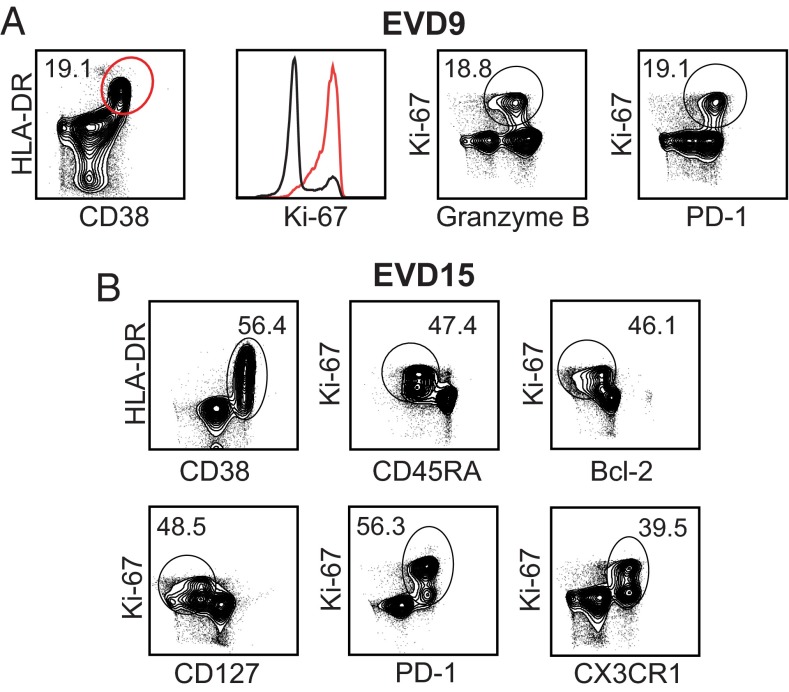
Fig. 3.
Phenotyping activated CD8 T cells in EVD patients. The expression of various effector cell markers on CD3+CD8+ T cells from EVD9 on day 31 after onset of symptoms (A) and in EVD15 3–9 d after onset of symptoms (B). The Ki-67 histogram is derived from the population depicted in red in the first plot.

