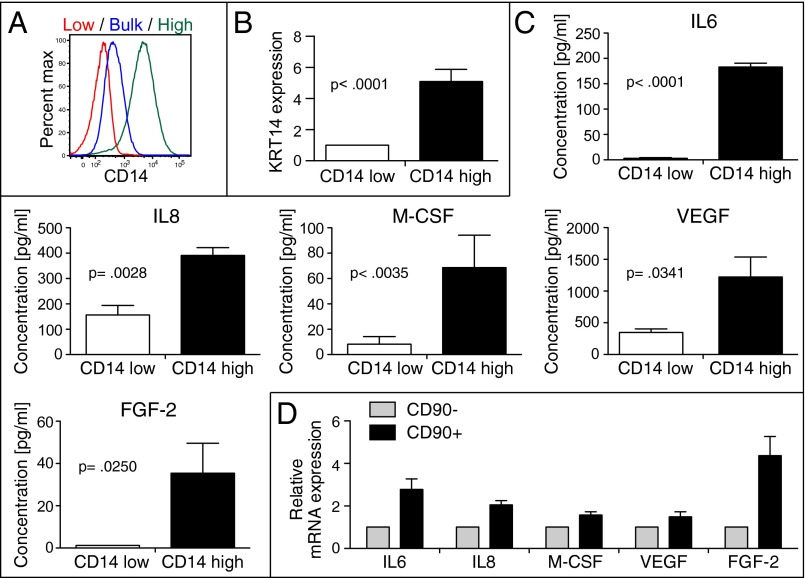
Fig. 1.
CD14-high BC cells express higher levels of inflammation factors. (A) Serial FACS isolation of CH14-high and CD14-low subpopulations from bulk 639V tumor cells and flow cytometry analysis of CD14 levels on each 639V subpopulation. (B) Quantitative PCR (qPCR) of KRT14 mRNA in CD14-low and CD14-high 639V cells (n = 4) (mean and SEM; P < 0.0001). (C) Cytokine profiling of CD14-high and CD14-low 639V cells using Luminex arrays (n = 4) (mean and SEM; IL6, P < 0.0001; IL8, P = 0.0028; M-CSF, P = 0.0035; VEGF, P = 0.0341; FGF-2, P = 0.0250). (D) Real-time PCR of inflammatory factors in CD90− and CD90+ tumor cells from basal patient BC samples (n = 3). Tumor cells were gated based on live, lineage (CD45, CD31)-negative cells (mean and SEM; IL6, P = 0.0245; IL8, P = 0.0077; M-CSF, P = 0.0266; VEGF, P = 0.0010; FGF-2, P = 0.0207).

