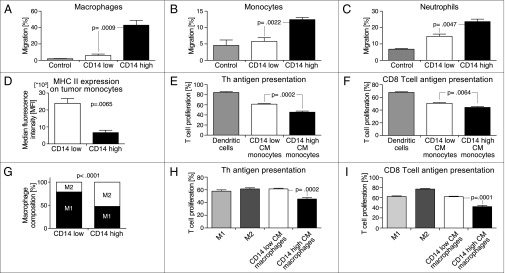
Fig. 3.

Inflammation mediators from CD14-high BC cells promote immune suppression. (A–C) Chemotaxis of macrophages, monocytes, and neutrophils across a transwell in response to different tumor CMs (n = 4) (mean and SEM; Macrophages, P = 0.0009; Monocytes, P = 0.0022; Neutrophils, P = 0.0047). (D) MHC II expression on tumor-infiltrating monocytic cells (Gr-1+ CD11b+) from each BC subpopulation (n = 4) (mean and SEM; P = 0.0065). (E) Presentation of OVA to TCR transgenic CD4+ Th cells by tumor CM-differentiated monocytes at 1:2.5 APC:T-cell ratio. Frequency of proliferating cells was determined by gating for CFSELO T cells (n = 5) (mean and SEM; P = 0.0002). (F) Presentation of OVA to TCR transgenic CD8+ CTL cells by tumor CM-differentiated monocytes at 1:5 APC:T-cell ratio. Frequency of proliferating cells was determined by gating for CFSELO T cells (n = 5) (mean and SEM; P = 0.0064). (G) Percentage of M2 macrophages over total TAMs in MB49 tumors (n = 5) (mean; P < 0.0001. (H) Presentation of OVA to TCR transgenic CD4+ Th cells by tumor CM-polarized macrophages at 1:10 APC:T-cell ratio (n = 5) (mean and SEM; P = 0.0002). (I) Presentation of OVA to TCR transgenic CD8+ CTL cells by tumor CM-polarized macrophages at 1:10 APC:T-cell ratio (n = 5) (mean and SEM; P = 0.0001).
