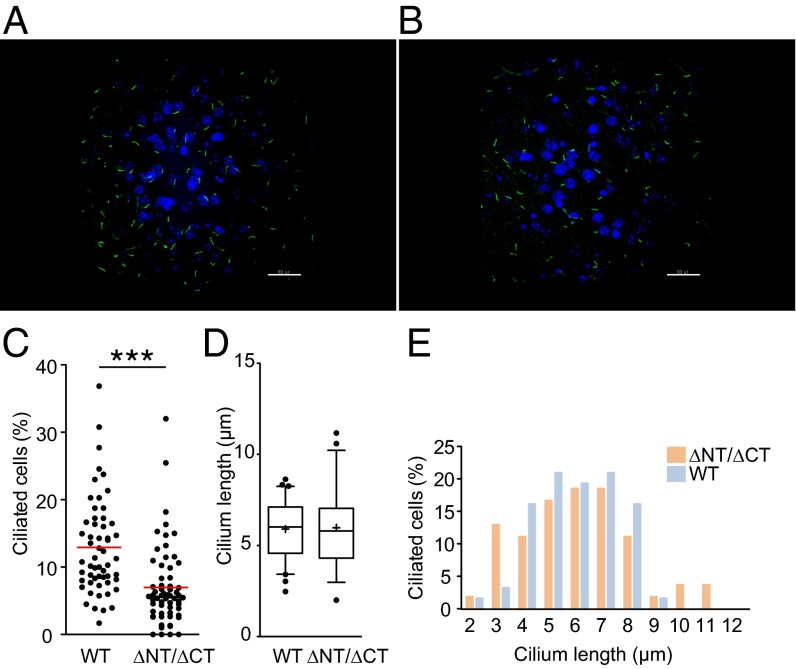
Fig. 1.
Quantification of primary cilia in the adult hippocampal granular cell layer. (A and B) Immunofluorescent visualization of ACIII-positive primary cilia (green) of WT (A) and didoΔNT/ΔCT (B) mice (z-projection of confocal stack; DAPI-stained nuclei in blue) (Scale bar, 30 μm.) (C) didoΔNT/ΔCT genotype is associated with a lower percentage of ciliated cells. Cilia were counted manually in 30 microscopy fields of 5-μm-thick brain sections from two WT and two didoΔNT/ΔCT mice. Individual values are shown; means are calculated for each genotype. Unpaired Student’s t test with Welch's correction, ***P < 0.001. (D and E) Length of individual cilia for WT (n = 62) and didoΔNT/ΔCT mice (n = 54) were determined (Materials and Methods and Fig. S2). (D) The median value and the 50th (boxes) and 10–90th percentile range (whiskers) are shown. Student's t test indicates no significant differences. (E) Distribution of cilia length in didoΔNT/ΔCT brain is different from WT. Snedecor's F distribution, P = 0.01.

