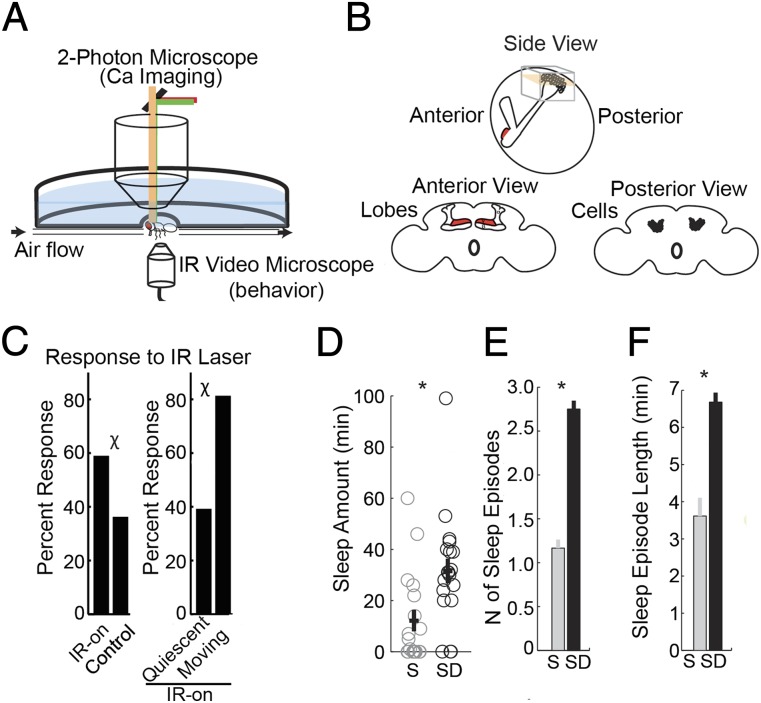
Fig. 1.
Identification of sleep and wake states during calcium imaging. (A) Experimental setup. The fly is positioned between the two-photon microscope and the infrared digital microscope, with the head attached to a chamber holding oxygenated saline solution (blue). Airflow passes through a hose ending in front of the head while a vacuum in the back expels the airflow. (B) Diagram detailing MB position in the fly brain. Cell bodies and calyx region (gray box) were imaged from the back of the head either as a stack of images throughout the entire cell body and calyx region (gray box) or as a time series from a single plane (pink). (C) Probability of movement in response to the switching on of the laser light vs. control stimulation (Left) with laser light on in previously moving flies vs. previously quiescent flies (Right). Laser power was set at 100%, and the intensity was used to assess GCaMP5 fluorescence. χ = P < 0.05 between groups (Pearson’s χ2 test). (D–F) Quantity and quality of sleep during testing in flies that either slept (S) or were sleep-deprived (SD) before testing. *P < 0.05 between sleep and sleep-deprived groups (Mann–Whitney test). Number of flies = 17 (sleeping) and 18 (awake).

