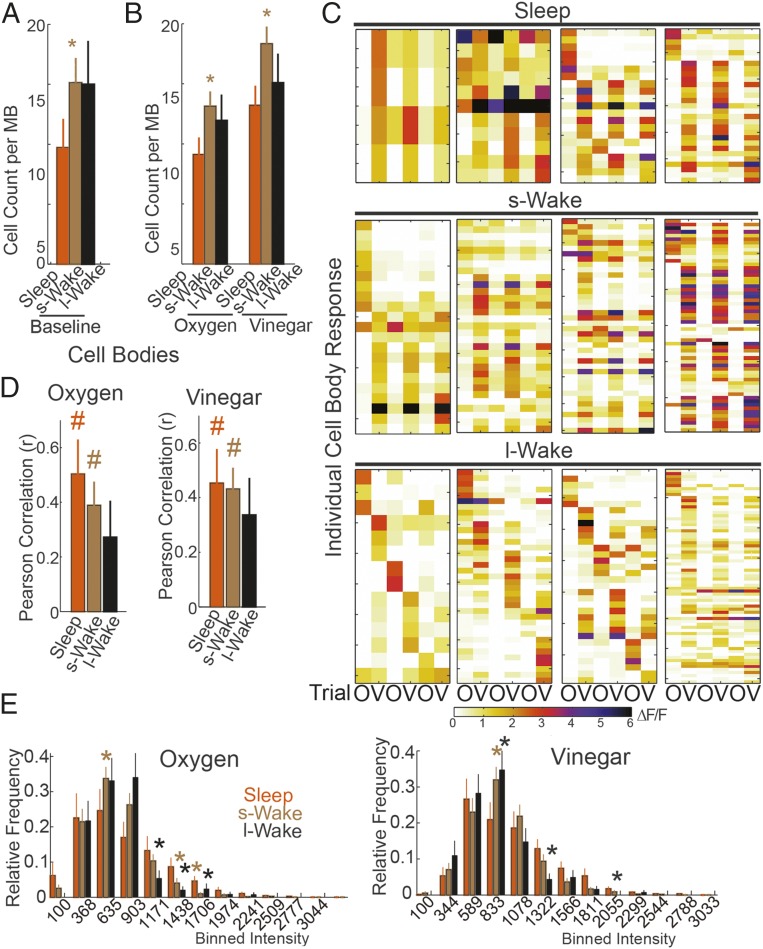
Fig. 4.
Effects of previous sleep or wake on baseline calcium levels and response to stimuli. (A) Number of spontaneously active cells during baseline. (B) Number of cells that responded to oxygen or vinegar throughout the three trials (at least in one of the three trials; stacked images). In A and B, the number of flies tested were sleep = 22, short-wake = 31, long-wake = 17. *P < 0.05 relative to sleep (post hoc Kruskal–Wallis test followed by Mann–Whitney test). All flies included were awake when tested. (C) Examples of cell response profiles from single flies that were asleep or awake for a short or long time before testing. Each row is a single cell, and columns indicate the ΔF/F response during the three trials for oxygen (O) and vinegar (V). Note that, because the number of responding cells varies across flies, the size of the panels and the width of the rows is not the same across flies. (D) Mean Pearson correlation (r) comparing the activation pattern in flies across trials (1–2, 2–3, 1–3) in response to oxygen (Left) and vinegar (Right). All flies were awake during testing and divided based on prior behavior: sleep, short wake, long wake. An r score of 1 would indicate a perfectly matched pattern. A “#” indicates that median values significantly differ from no correlation (Wilcoxon signed-rank test, P < 0.05). (E) Frequency plots describing the range in mean fluorescent response for each cell. Responses were subdivided based on their intensity into bins of 268 relative units, and the rate (number of responses/total number of cells) within each bin is plotted for the three groups. For each bin, an asterisk indicates a significant difference from the sleep group (Kruskal–Wallis test followed by Mann–Whitney test, P < 0.05). Note that the frequency of high-intensity responses is also reduced after short wake relative to sleep, but the overall increased number of responses compensates for this effect.

