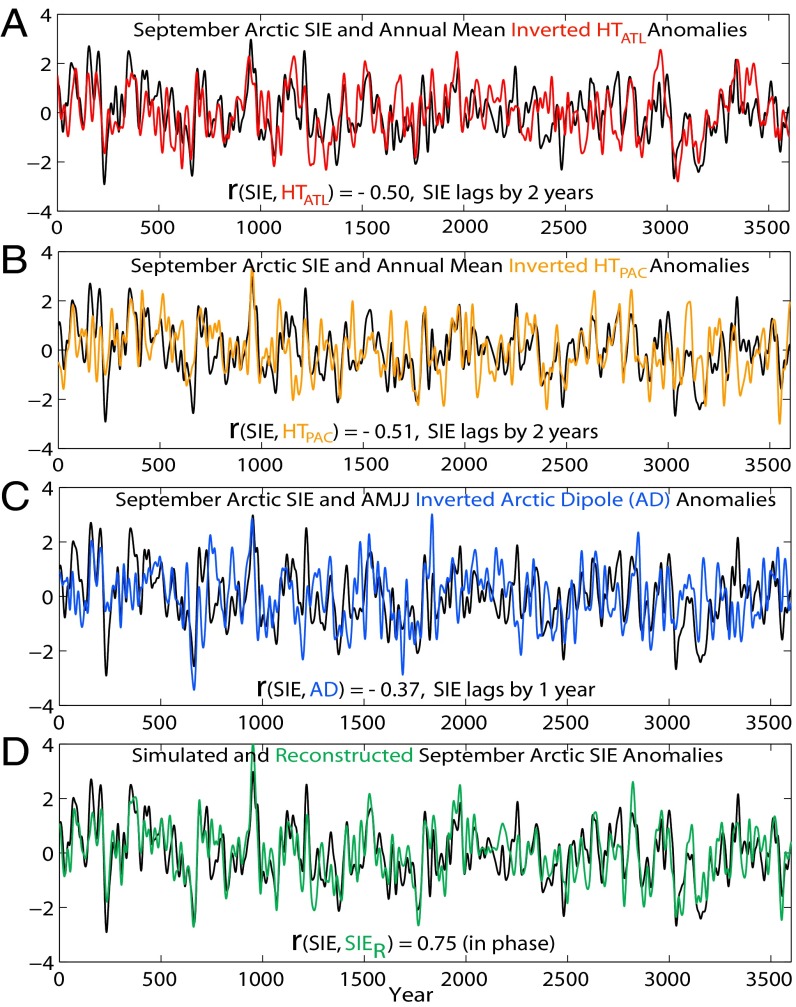
Fig. 1.
Anomalies from GFDL CM2.1 control simulation. September Arctic SIE anomalies with (A) inverted annual mean HTATL, (B) inverted annual mean HTPAC, (C) inverted spring AD, and (D) reconstructed September Arctic SIE anomalies. All time series are 30-y LF and normalized by corresponding SDs [σ(SIE) = 0.22 × 10⁶ km2, σ(SIER) = 0.17 × 10⁶ km2, σ(HTATL) = 8.5 TW, σ(HTPAC) = 0.35 TW, σ(AD) = 8.0 hPa].

