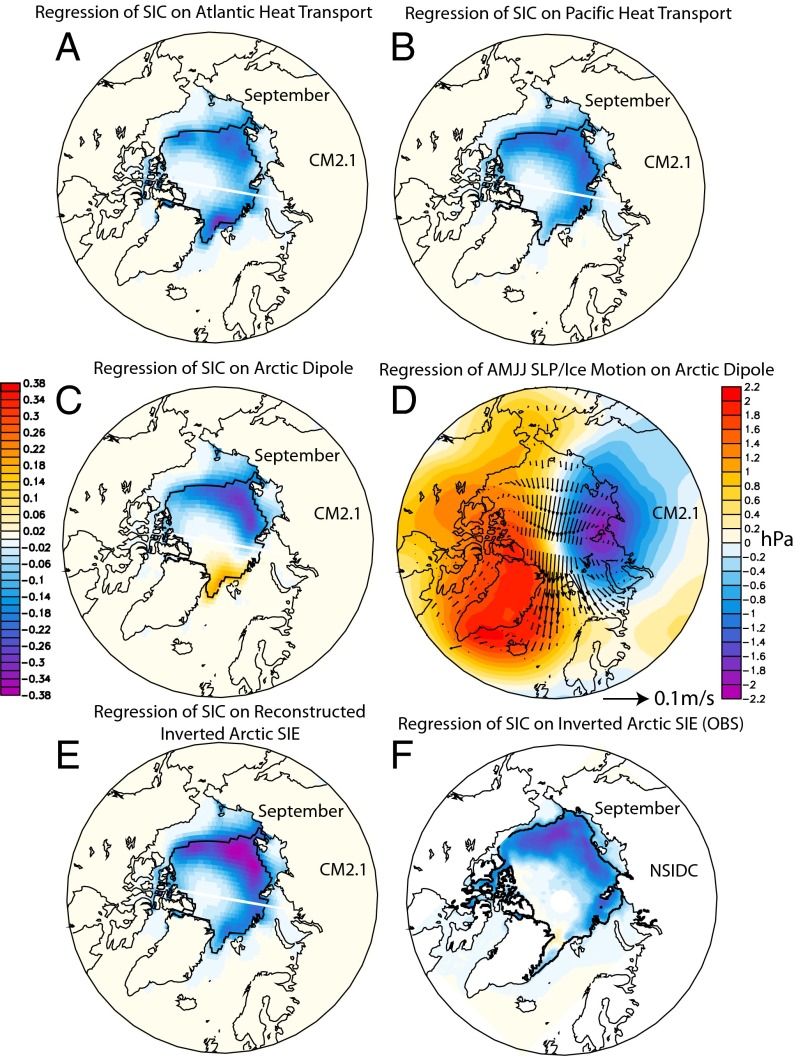
Fig. 2.
Spatial pattern. (A−C) Regression of anomalous September SIC on 0.65 million km2, 0.58 million km2, and 0.32 million km2 reduction of September Arctic SIE induced by anomalous HTATL (2-y lead) (A), HTPAC (2-y lead) (B), and AD (1-y lead) (C), respectively (Eq. 2). (D) Regression of anomalous April−July (AMJJ) SLP/ice motion on AD (1-y lead) as in C. (E) Regression of anomalous September SIC on 1 million km2 reconstructed inverted September Arctic SIE anomaly (Eq. 2). (F) Regression of observed anomalous September SIC on 1 million km2 inverted observed September Arctic SIE anomaly (1979−2013). Note that A−E are LF regressions from CM2.1 and F is unfiltered regression from observation. Thick black lines denote climatological September ice edges. The white lines in A−C and E are due to the polar projection of SIC simulated on tripolar grids in CM2.1.

