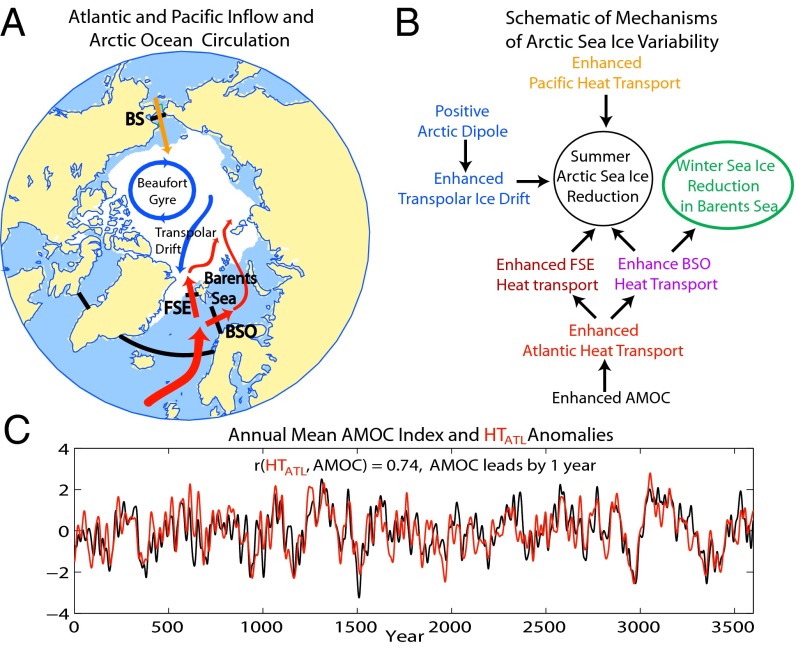
Fig. 3.
Mechanisms for low-frequency variability of summer Arctic SIE. (A) Schematic of Atlantic/Pacific inflow (red/orange arrows) and Arctic ocean circulation. White color reflects observed climatological September SIE over 1979–2013. (B) Schematic of key mechanisms. (C) Simulated LF annual mean AMOC index and HTATL anomalies, normalized by their SDs [σ(AMOC) = 0.8 Sverdrup]. BS, Bering Strait.

