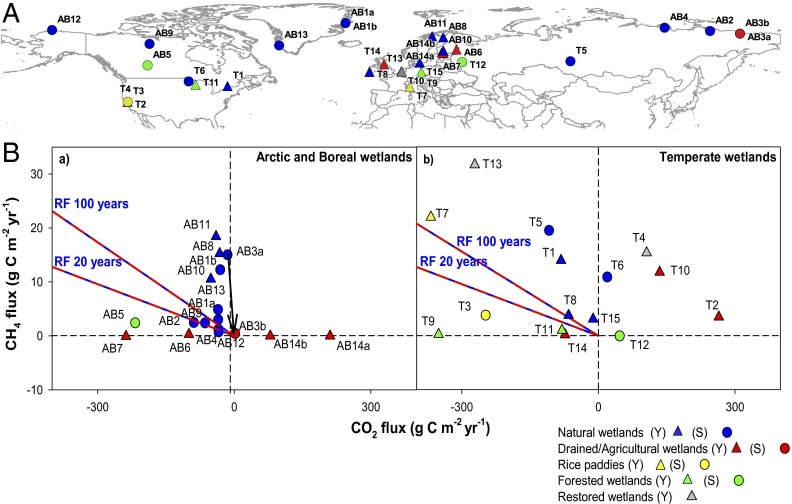
Fig. 1.
(A) Global distribution of the 29 measurement sites involved in the present analysis. Triangles represent sites with annual budgets (Y) and circles represent sites with growing season budgets (S). Site IDs and description are reported in SI Text, Site Analysis and Tables S1 and S2. (B) CH4 vs. CO2 flux (in grams C⋅m−2⋅y−1) for arctic/boreal and temperate wetlands relative to the modeled RF equilibrium lines. The two blue–red equilibrium lines represent the ratio of sustained CO2 and CH4 fluxes (grams CO2-C⋅m−2⋅y−1 per gram CH4-C⋅m−2⋅y−1) that would result in a zero cumulative RF over the period indicated for the line (20 y and 100 y). The slope of the line depends on the constant CO2 uptake rate that would be needed for compensating the positive RF of a unit CH4 emission at a fixed changing time. The arrow pointing down (AB3a to AB3b) indicates the carbon flux change at the specific site after a drainage experiment.

