
Fig. 3.
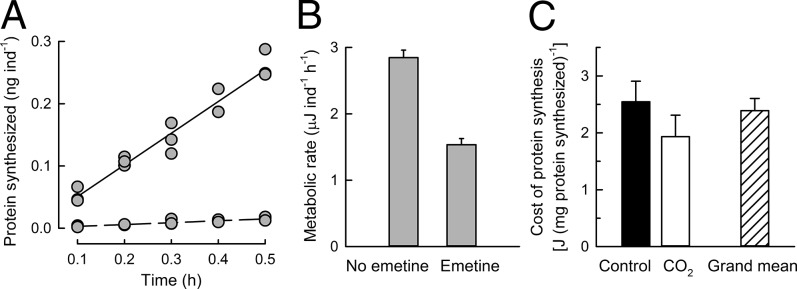
Energy cost of protein synthesis in developing sea urchins. (A) Protein synthesis of 1-d-old embryos in the absence (solid regression line, rate = 0.51 ± 0.032 nanograms per individual per hour, slope ± SE of slope) and presence (dashed regression line, rate = 0.03 ± 0.004 nanograms per individual per hour) of 100 µM emetine. Synthesis rates were calculated from triplicate, five-point time-course assays. (B) Metabolic rate measured as oxygen consumption, for the cohort of embryos in A, converted to energy equivalents (expressed in microJoules). Error bars represent 1 SEM, n = 8 respiration assays. (C) The cost of protein synthesis was calculated from the simultaneous decreases in protein synthesis and metabolic rate under inhibition by emetine. Error bars represent 1 SEM. The energy cost of protein synthesis did not differ significantly between control (black bar, n = 3) and seawater acidification (open bar, n = 3) treatments (t test, df = 4, t = 1.178, P = 0.304). The grand mean (hatched bar) of 2.4 ± 0.21 J/mg protein synthesized was calculated from all cost determinations (n = 9) for two pCO2 treatments and developmental stages spanning 1-d-old embryos to 10-d-old larvae.