Fig. 4.
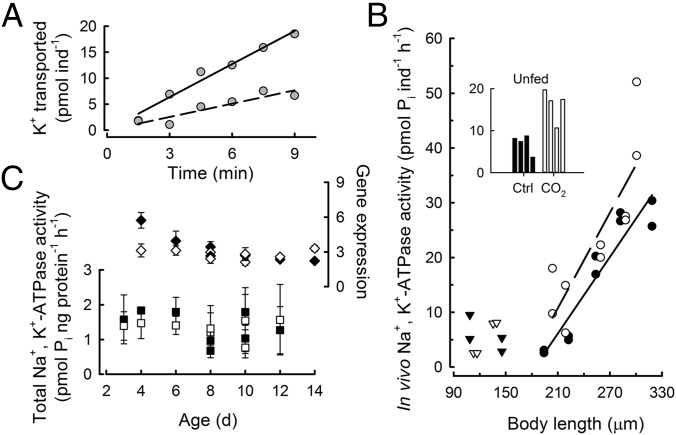
Ion transport rate, total enzyme activity, and gene expression of Na+,K+-ATPase in developing sea urchins. (A) In vivo Na+,K+-ATPase activity was determined from 86Rb+ transport rates, corrected for the specific activity of K+ in seawater, in the absence (solid regression line, rate = 2.1 ± 0.19 picomoles K+ per individual per minute, slope ± SE of slope) and presence (dashed regression line, rate = 0.9 ± 0.18 picomoles K+ per individual per minute) of 2 mM ouabain. (B) In vivo Na+,K+-ATPase activity under control (closed symbols) and seawater acidification (open symbols) treatments in embryos (triangles) and larvae (circles) as a function of body size. Each data point was calculated from time-course assays as shown in A. (Inset) The bar graph shows duplicate measurements on 6- and 8-d-old unfed larvae. Seawater acidification treatment significantly increased in vivo Na+,K+-ATPase activity in growing larvae (ANCOVA, P = 0.016, n = 20) as well as in unfed larvae (Inset). Post hoc test, P = 0.001, n = 8. (C) Relative Na+,K+-ATPase gene expression and total enzyme activity. Error bars indicate 1 SEM, n = 3–4 assays. Where not visible, error bars fall within the graphical representation of the data point. No statistical differences in gene expression or total enzyme activity occurred between control and acidification treatments, with the exception of 4-d-old larvae (∼220 µm). For this stage, gene expression did not predict the changes in physiological rates of ion transport (B), because gene expression was higher in the control relative to acidification treatment (post hoc test, P < 0.001).

