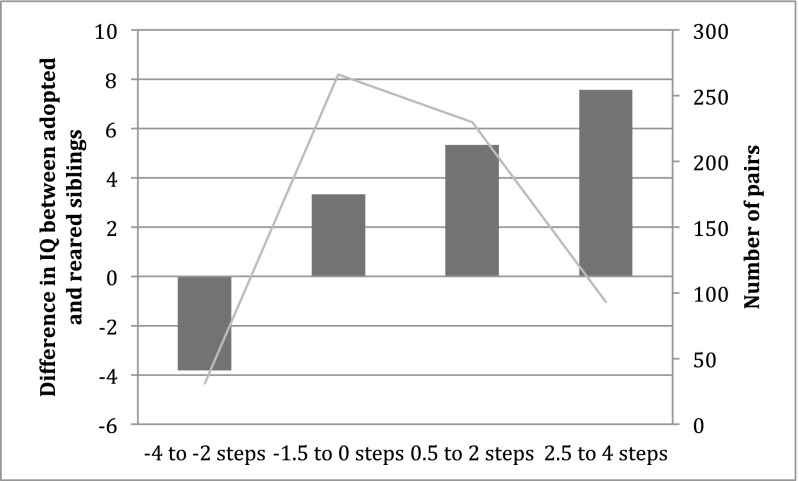
Fig. 1.
Magnitude of IQ difference (black bars and left y axis) between adopted and nonadopted full-siblings as a function of the difference in educational level between biological and adoptive parents of the adopted siblings (x axis). The four bars represent (from left to right) −4 to −2 steps; −1.5 to 0 steps; 0.5–2 steps; and 2.5–4 steps difference on the education scale. The gray line (right y axis) illustrates the number of pairs in each group.

