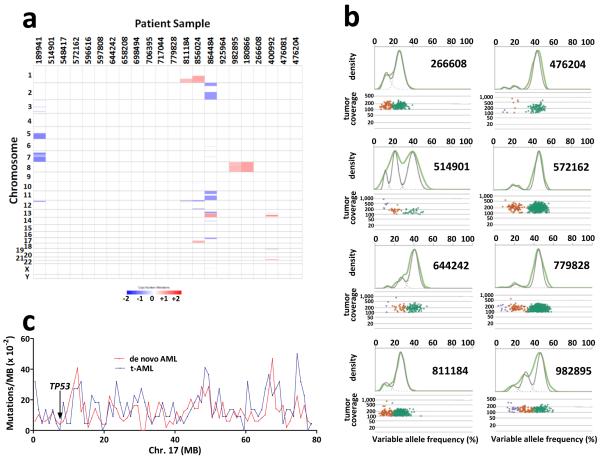
Extended Data Figure 1. Whole genome sequencing analysis of tAML.
a, Somatic copy number alterations in the 22 cases of t-AML. Blue indicates copy number loss. Red indicates copy number gain. b, Representative clonality plots for 8 cases of t-AML are shown. Scatter plots (lower panel) show variant allele frequency and read depth in the tumor sample. Variant alleles in the founding clone are depicted as green, while variants in subclones are depicted as orange or purple. The upper panels contain kernel density plots of the VAF data (green line) along with the posterior predictive densities (grey line) from the mathematical model used to segregate clusters. c, Frequency of Tier 1 silent, Tier 2, and Tier 3 mutations in 1 Mb increments across chromosome 17 in de novo AML and t-AML. The TP53 genomic locus is identified.

