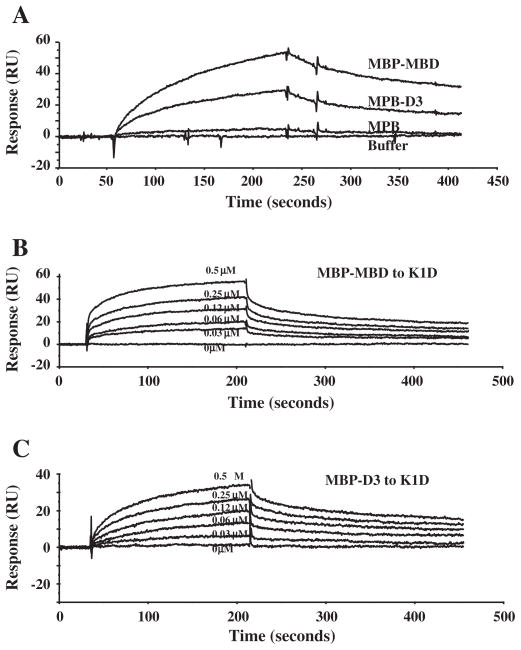
Fig. 3.
Kinetic analysis of interaction between K1D and ankyrin R polypeptides by surface plasmon resonance assay. A: GST-tagged K1D fragment was immobilized onto a CM5 sensor chip. MBP, MBP-MBD or MBP-D3 at a concentration of 1 μM was injected at 20 μl/min over the chip surface in a BIAcore 3000 instrument. B: MBP-MBD at different concentrations as indicated was injected at 20 μl/min over the surface in a BIAcore 3000 instrument. The figure shows dose–response curves of MBP-MBD binding to K1D. C: MBP-D3 at different concentrations as indicated was injected at 20 μl/min over the surface in a BIAcore 3000 instrument. The figure shows dose–response curves of MBP-D3 binding to K1D.

