Figure 2.
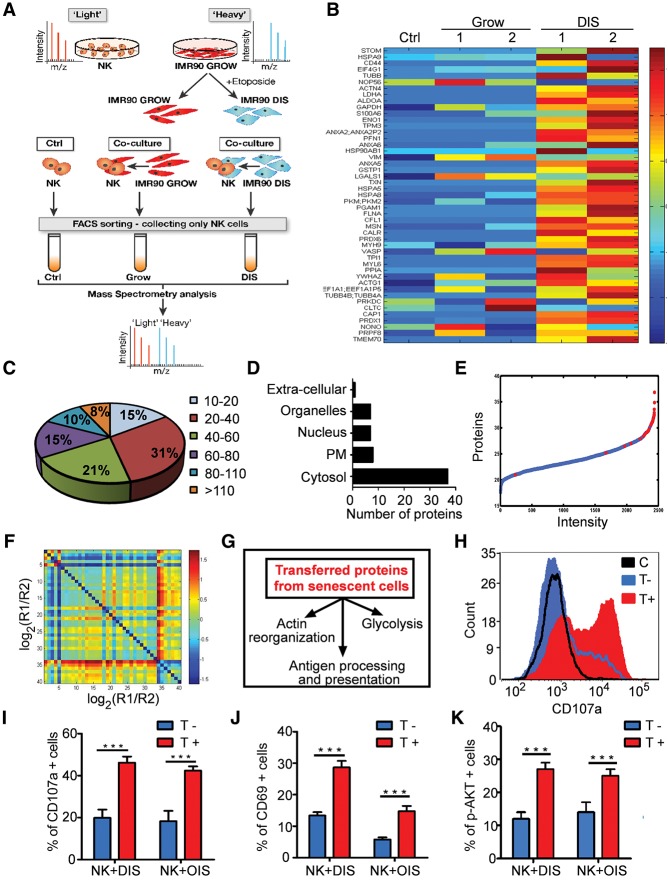
Transferred proteins identified by proteomic analysis lead to NK activation and cytotoxicity. (A) Diagram of the trans-SILAC experiment. (B) SPIN-ordered expression matrix. Colors depict relative levels of transfer (centered and normalized), where red denotes high levels of transfer, and blue denotes low levels of transfer. Rows represent proteins, and columns represent samples: NK92 cells without coculture (Ctrl) or cocultured with growing control (Grow) or DIS cells. (C) Size distribution (in kilodaltons) of the identified transferred proteins. (D) Subcellular localization of the identified transferred proteins. (E) Quantitative proteomic analysis of DIS cells. Proteins from senescent cells were ranked according to their relative intensity levels, reflecting protein abundance. Transferred proteins from DIS to NK92 cells are marked in red. (F) A matrix of protein ratios R1/R2, where the transferred protein abundance is denoted by R1 and protein abundance in DIS cells is denoted by R2. (G) Kyoto Encyclopedia of Genes and Genomes (KEGG) pathway analysis identified the pathways affected by the transferred proteins. (H–K) Primary human NK cells were cocultured for 1 h with OIS or DIS cells, collected, and gated by FACS as T− or T+ compared with control (C) NK cells. (H) Representative FACS analysis of CD107a levels in control, T−, and T+ populations following IPT from DIS cells. (I) Average percentage of CD107a-positive cells in T− and T+ populations. (J) Average percentage of CD69-positive cells in T− and T+ populations. (K) Average percentage of phosphorylated AKT (p-AKT)-positive cells between T− and T+ populations. Results are expressed as means ± SEM from at least three independent experiments. (***) P < 0.001.

