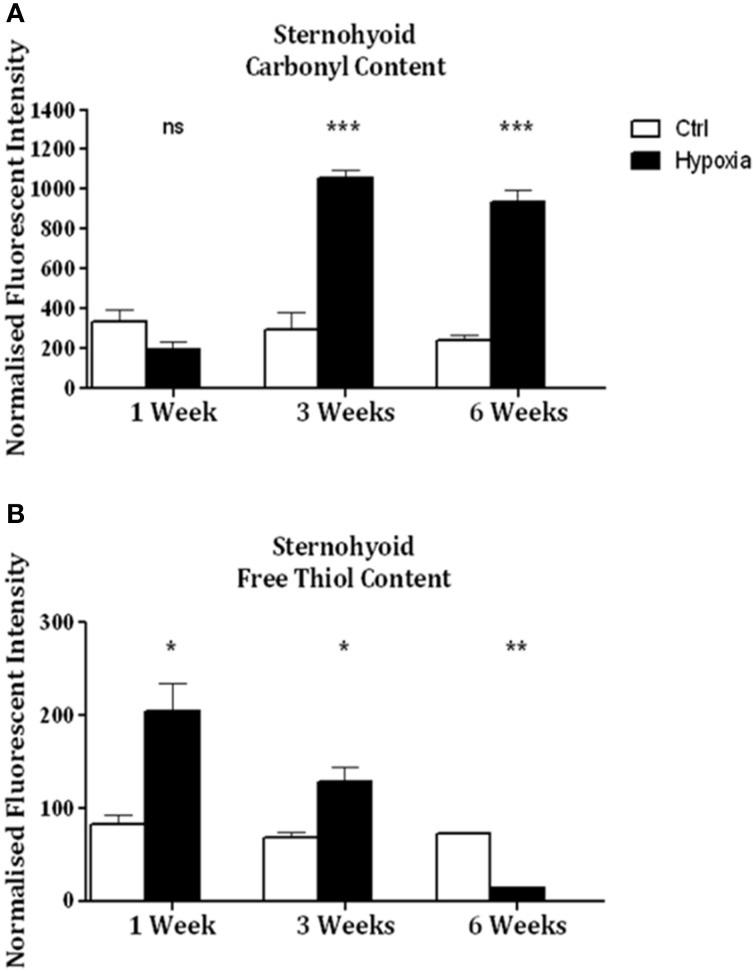
Figure 2.
Sternohyoid protein carbonyl and free thiol content after 1, 3, and 6 weeks of sustained hypoxia compared to normoxic controls. (A) Sternohyoid protein carbonyl content (mean ± SEM) after 1, 3, and 6 weeks of normoxia or sustained hypoxia expressed as normalized fluorescence intensity; n = 5–8 per group; (B) Sternohyoid protein free thiol content (mean ± SEM) after 1, 3, and 6 weeks of normoxia or sustained hypoxia expressed as normalized fluorescence intensity; n = 7–8 per group; *p < 0.05, **p < 0.01, ***p < 0.001, ns, not significant; Student t-test or Mann-Whitney test as appropriate. Ctrl, normoxic control; Hypoxia, sustained hypoxia (FiO2 = 0.1).

