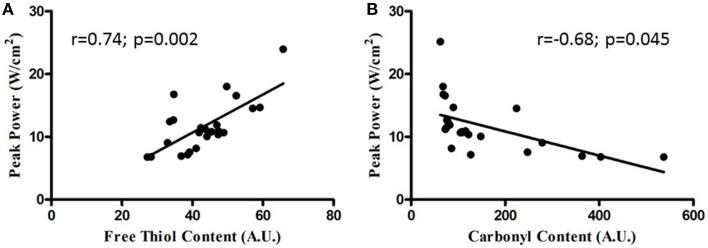
Figure 9.
Relationship between sternohyoid power and oxidative stress markers. Relationship between sternohyoid specific peak power and muscle oxidative stress markers [protein free thiol content (A) and carbonyl content (B)] plotting data from all animals in the second cohort of studies; n = 24. Note the correlation coefficients and statistically significant relationships.

