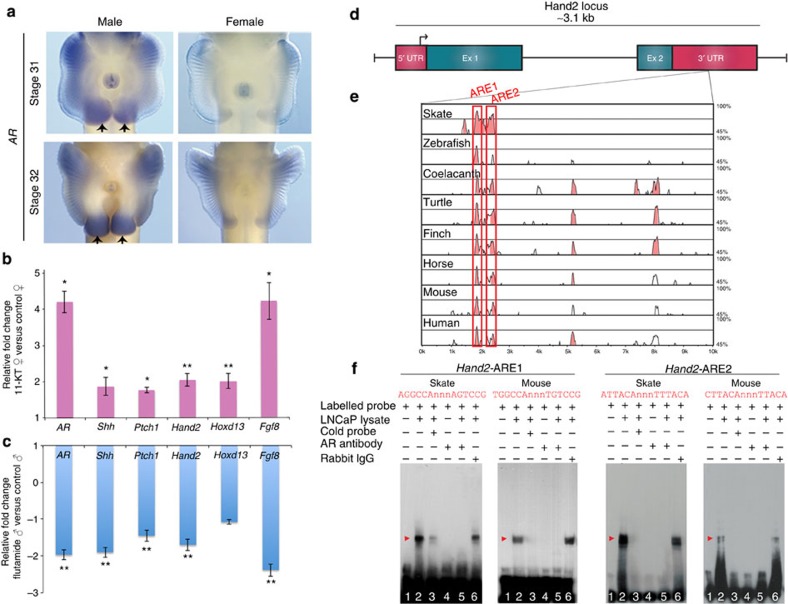
Figure 4. Androgen receptor regulation of the fin development circuit in skate pelvic fins.
(a) In situ hybridization of AR in male and female pelvic fins. Note the strong expression in the developing claspers (arrows). (b) Relative levels of gene expression in 11-KT-treated female fins (N=5) versus controls (N=4). (c) Relative gene expression in male fins after functional inactivation of AR by flutamide. Fold changes were determined by comparison of flutamide-treated (N=7) versus control male (N=5) pelvic fins. Error bars in b,c represent±s.e.m.; asterisks denote significant differences where one indicates P<0.05 and two indicate P<0.01. (d) Schematic diagram of the Hand2 locus in L. erinacea. (e) VISTA plot of a portion of the 3′ UTR of Hand2 in eight vertebrates, with elephant shark as the reference sequence. The first two peaks (boxed) contain conserved AREs (labelled ARE1 and ARE2). (f) Gel shift assay demonstrates binding of Hand2-ARE1 and ARE2 by androgen receptor protein. Red arrows denote shifts indicative of protein:DNA complexes. In all EMSA blots, Lane 1 is free probe only, Lane 2 is labelled probe and LNCaP lysate, and Lane 3 is cold competition assay (observed shift is outcompeted with excess unlabelled probe). Lane 4 is labelled probe and antibody only (no interaction). Lane 5 is labelled probe, LNCaP lysate and antibody; the specific block shift in Lane 5 confirms that the shift in Lane 2 was specific to formation of an AR:DNA complex. Lane 6 is an additional control using Rabbit IgG in place of the AR antibody; the persistence of the shift provides further support that the the block shift in Lane 5 is specific to AR.

