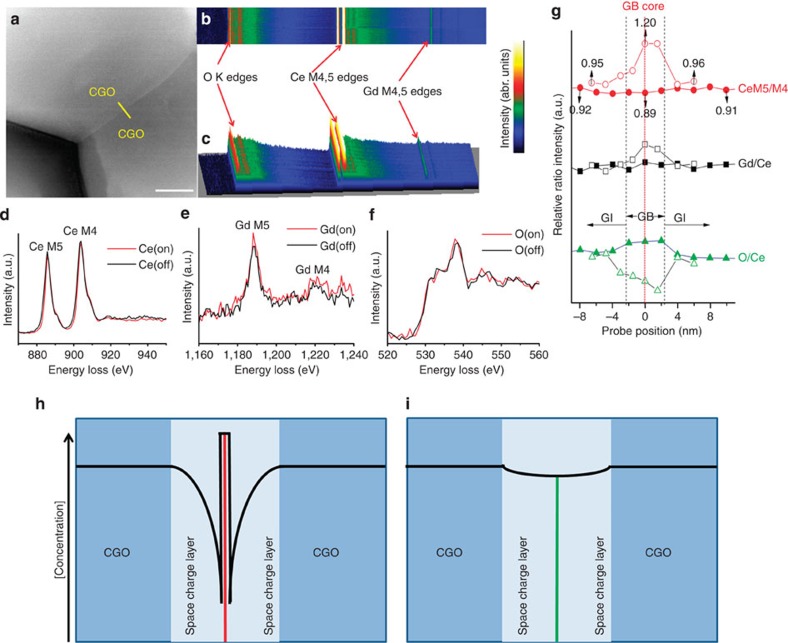
Figure 2. CGO–CGO grain boundaries in CGO–CFO6040 revealed by STEM-EELS.
(a) The survey image including the EELS line scan across the CGO–CGO grain boundary (GB) from the CGO–CFO6040 composite; (b) and (c) are EELS line scan signal profiles presenting in two-dimensional and three-dimensional mode, respectively; (d), (e) and (f) are ELNES spectra of Ce M4,5, Gd M4,5 and O K edges extracted at (marked by on) or ∼10 nm away from (marked by off) the CGO–CGO grain boundary core, respectively; (g) profile of the CeM5/M4, Gd/Ce and O/Ce ratio near the CGO–CGO boundary (The solid symbol results are from this work, while the hollow symbol results are from single-phase CGO26. The grain boundary thickness of both samples is ∼4 nm); The proposed oxygen vacancy concentration profiles near the CGO–CGO grain boundary zone of (h) single-phase CGO and (i) CGO–CFO6040 composite. The GB core was highlighted by red and green line in h and i, respectively. Scale bar, 100 nm (a).

