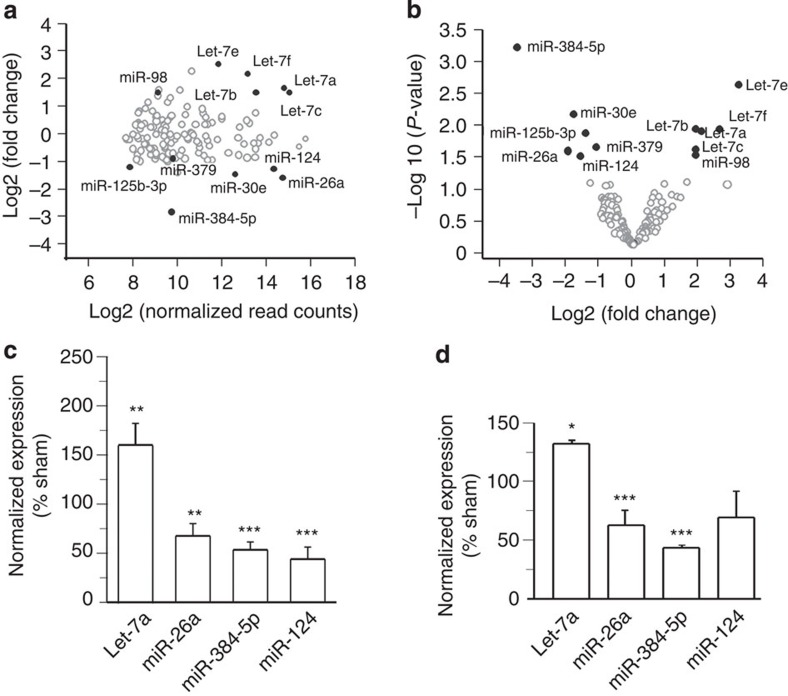
Figure 1. miRNAs differentially expressed in LTP.
(a) The fold change (on log2 scale) of each miRNA is plotted against its normalized read number (on log2 scale). (b) The P value (on a log10 scale) of each miRNA is plotted against its fold change (on a log2 scale). In a and b, each circle represents one miRNA; miRNAs with P values less than 0.05 are illustrated by solid circles. (c) Normalized miRNA expression (n=5 slices from three rats for each condition) in rat hippocampal slices stimulated with high-frequency stimulation. (d) Normalized miRNA expression (n=4–7 experiments for each condition) in cultured rat hippocampal neurons stimulated with TEA. In c and d, data are presented as mean±s.e.m. Student's t-test or Mann–Whitney U-test (determined by the distribution and variance of the data) was used for comparison between control and stimulated samples in c and d; *P<0.05, **P<0.01, ***P<0.001.

