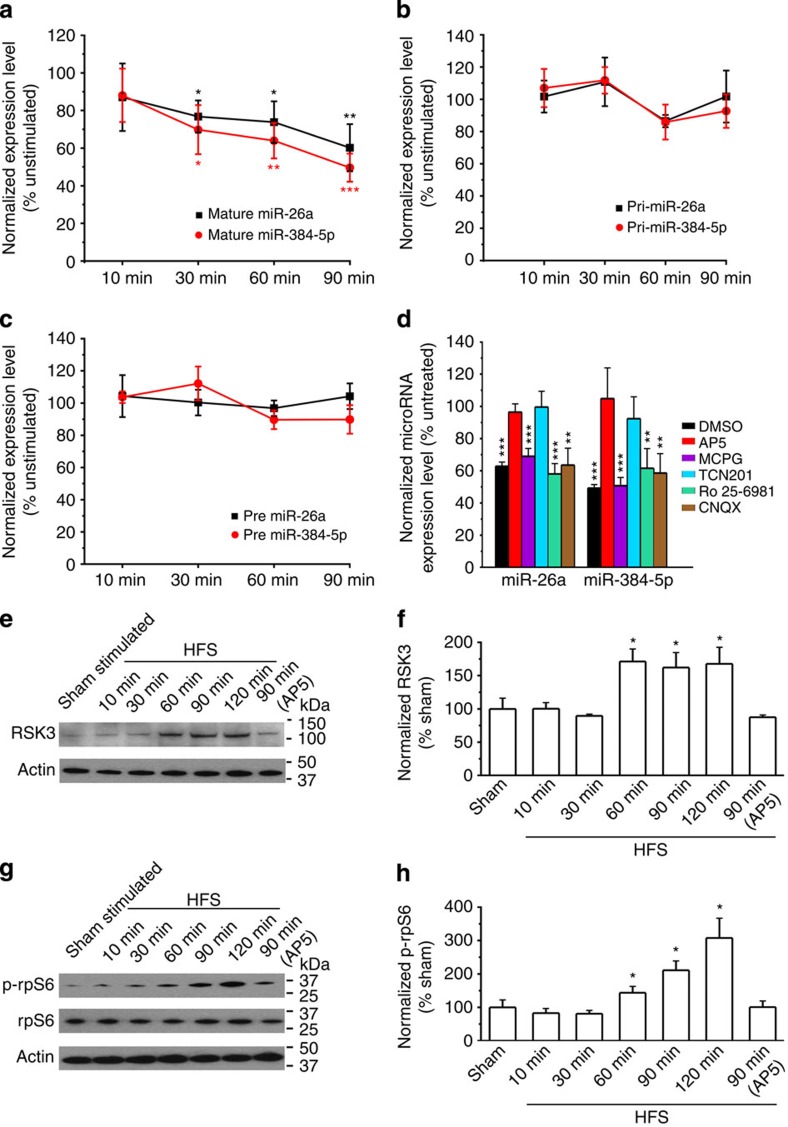
Figure 7. miR-26a and miR-384-5p are regulated at post-transcriptional levels by GluN2A in LTP.
LTP was induced in hippocampal slices by stimulating the Schaffer collateral pathway with high-frequency stimulation. The CA1 region was removed at indicated time points after stimulation for miRNA (a,d), pri-miRNA (b), pre-miRNA (c) and protein analyses (e–h). n=8–9 slices (qRT–PCR) or 4–5 slices (immunoblot) for each condition. Data are presented as mean±s.e.m. Kruskal–Wallis and Mann–Whitney U-tests are used for statistical analysis between unstimulated (a–d) or sham-stimulated (e–h) slices and stimulated slices harvested at different post-stimulation time points. *P<0.05, **P<0.01, ***P<0.001. In a–c, black asterisks indicate statistically significant differences for mature, pri- and pre-miR-26a, and orange asterisks indicate those for mature, pri- and pre-miR-384-5p.

