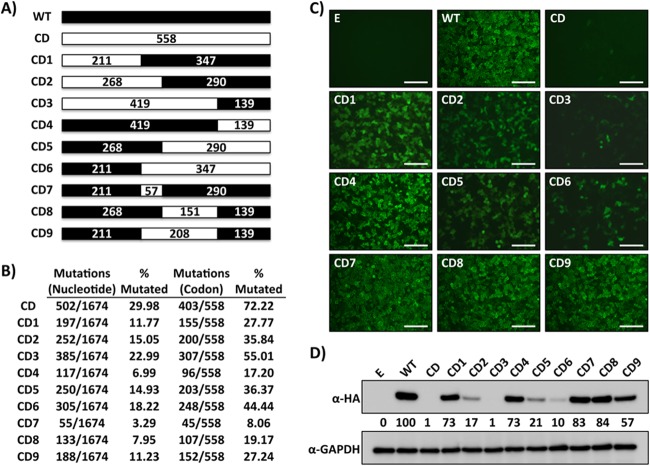
FIG 1.
Characterization of CD LCMV NP chimeras. (A) Schematic representation of LCMV NPCD chimeras. Wild-type LCMV NP (NPWT) regions are represented by black boxes. The white boxes represent LCMV NPCD. The numbers indicate the amino acid lengths of the respective regions. (B) Nucleotide and amino acid changes in LCMV NPCD chimeras. The discrepancies between mutated codons and the amino acid lengths indicated in panel A are due to codons that are already deoptimized in LCMV NPWT or that encode either methionine or tryptophan. (C and D) LCMV NPCD chimera expression levels. Human 293T cells were transiently transfected with expression plasmids encoding LCMV NPCD chimeras and evaluated at 48 h p.t. for protein expression by IFA (C) and WB (D) using an anti-HA mouse monoclonal antibody. Empty plasmid (E) and LCMV NPWT were included as negative and positive controls, respectively. GAPDH expression levels were used as loading controls. Representative images of three independent transfection experiments are shown. (D) The numbers indicate the percentages of LCM NPCD expression compared to that of LCMV NPWT after normalization with GAPDH. (C) Scale bars = 100 μm.

