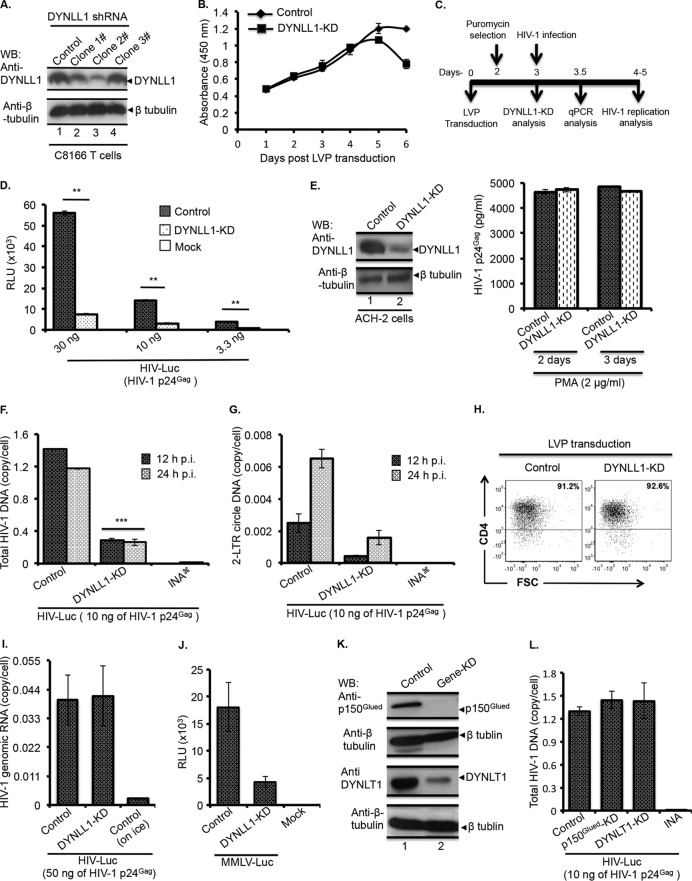
FIG 1.
DYNLL1 is required for HIV-1 reverse transcription. (A) DYNLL1 knockdown. DYNLL1 expression in LVP-transduced cells was examined by WB (top panel) using an anti-DYNLL1 antibody. The expression of β-tubulin was included as loading control (bottom panel). (B) A WST-1 cell proliferation assay was performed at the indicated time points following the LVP transduction to determine the proliferation of control and DYNLL1 LVP-transduced cells. (C) Diagram showing LVP transduction and different time intervals for HIV-1 infection and DNA transfection experiments following LVPs transduction. (D) Control or DYNLL1-KD C8166T cells (0.5 × 10⁶) were infected with different doses of HIV-Luc. At 24 h p.i., viral replication was examined by measuring Luc activity. The statistical significance between the control and DYNLL1-KD cells infections was determined by Student's t test. **, P < 0.01 (n = 3). (E) Left, control or DYNLL1-KD ACH-2 cells were incubated with PMA (2 μg/ml). Right, on day 2 or 3 of PMA treatment, the p24Gag concentration in supernatants was determined using HIV-1 p24Gag ELISA (shown on right side). The data were confirmed in two independent experiments. (F and G) Control or DYNLL1-KD C8166T cells (1.5 × 10⁶) were infected with HIV-Luc. At 12 and 24 h p.i., total HIV-1 DNA (F) and 2-LTR circle DNA (G) were quantified by qPCR. The values shown are the averages of triplicates with the indicated standard deviations. A two-way analysis of variance (ANOVA) was performed to determine the statistical significance between the samples. ***, P < 0.001 (n = 3). The data were confirmed in three independent experiments. (H) Control or DYNLL1-KD C8166T cells were stained with anti-CD4-APC or isotype control antibodies and analyzed by flow cytometry. Representative flow cytometric images show the expression of CD4 receptor on the gated live cells. Student's t test was employed to determine the statistical significance. (I) HIV-1 entry into control or DYNLL1-KD cells, as determined by quantifying HIV-1 genomic RNA. (J) Control or DYNLL1-KD cells (0.5 × 10⁶) were infected with equal amounts of MMLV-Luc. At 24 h p.i., the MMLV replication was examined by measuring Luc activity. (K) p150Glued and DYNLT1 knockdown. p150Glued or DYNLT1 expression in the LVP-transduced cells was examined by WB using corresponding antibodies. The expression of β-tubulin was included as loading control. (L) Control, p150Glued-KD, or DYNLT1-KD C8166T cells (1.5 × 10⁶) were infected with HIV-Luc (at 10 ng of HIV-1 p24Gag). At 12 h p.i., total HIV-1 DNA was quantified by qPCR. RLU, relative light units. INA  , heat-inactivated virus control.

