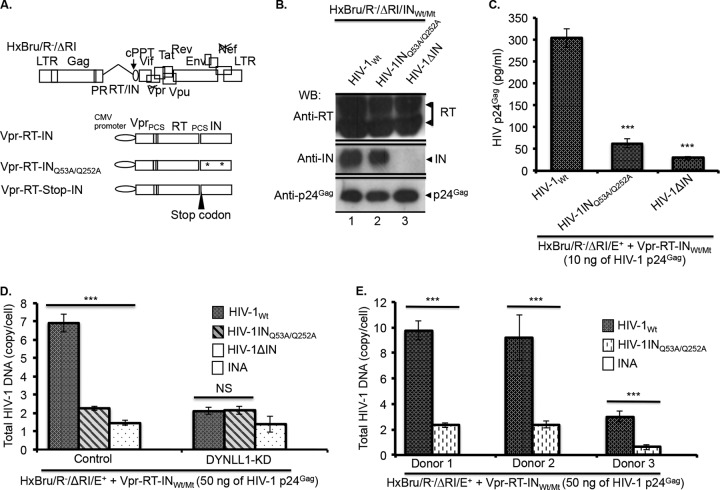
FIG 4.
HIV-1 INQ53A/Q252A mutant virus is defective for reverse transcription. (A) Diagrammatic representation of the HxBru/R−/ΔRI/E+ provirus and the Vpr-RT-INWt,/Mt fusion protein expression vectors. (Adapted from reference 42.) (B) HIV-1Wt, HIV-1INQ53A/Q252A, or HIV-1ΔIN virus-incorporated RT (top panel), IN (middle panel), and p24Gag (bottom panel), detected as described in Materials and Methods. (C) C8166T cells (0.5 × 10⁶) were infected with the HIV-1Wt, HIV-1INQ53A/Q252A, or HIV-1ΔIN virus (at 10 ng of virus-associated p24Gag), and HIV-1 replication was analyzed by HIV-1 p24Gag ELISA, as described in Materials and Methods. The values shown are the averages of triplicates with the indicated standard deviations. The statistical significance between the infections was determined by using a one-way ANOVA. ***, P < 0.001 (n = 3). The data were confirmed in two independent experiments. (D) Control or DYNLL1-KD C8166T cells (1.5 × 10⁶) were infected with the HIV-1Wt, HIV-1INQ53A/Q252A, and HIV-1ΔIN viruses (at 50 ng of virus-associated p24Gag). At 12 h p.i., the total HIV-1 DNA was quantified by qPCR. The values shown are the averages of triplicates with the indicated standard deviations. One-way ANOVA was performed to determine the statistical significance. The data were confirmed in two independent experiments. ***, P < 0.001 (n = 3); #, nonsignificant (NS). (E) Primary human CD4+ T cells were purified from PBMCs of three healthy adult human volunteers and stimulated with PHA (3 μg/ml) as described in Materials and Methods. CD4+ T cells (1.5 × 10⁶) following stimulation were infected with HIV-1Wt and HIV-1INQ53A/Q252A (at 50 ng of virus-associated p24Gag), and total HIV-1 DNA was quantified at 24 h p.i. as described in Materials and Methods. The Student t test was used to determine the statistical significance. ***, P < 0.001 (n = 3). INA, heat-inactivated virus control.

