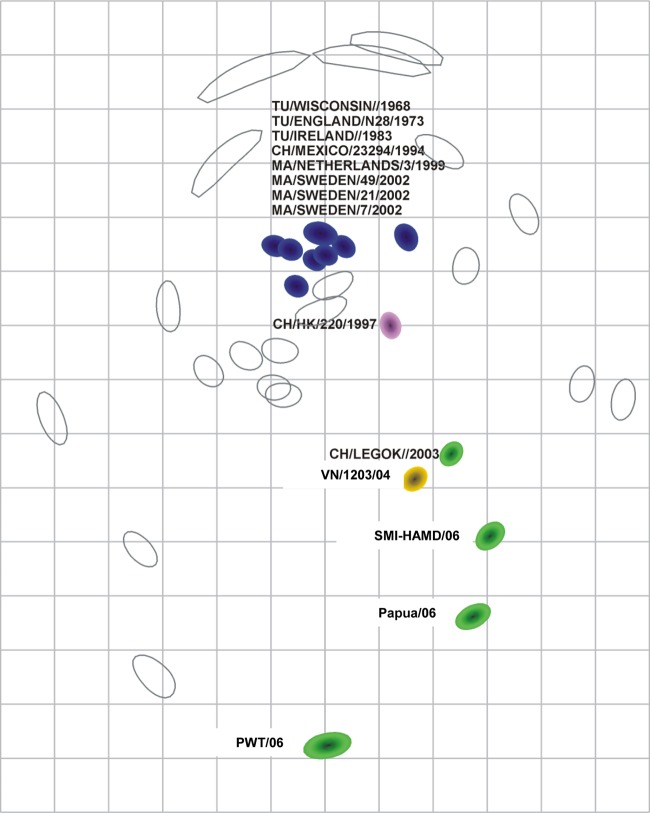
FIG 3.
Cartographic map of H5 avian influenza viruses produced with chicken antisera. The colored shapes (viruses) and open shapes (antisera) are relative positions adjusted such that the distances between viruses and antisera in the map represent the corresponding HI measurements with the least error. The blue fill represents the antigenic root from classic H5 influenza viruses, including four viruses of wild bird origin (A/mallard/Netherlands/3/1999 [MA/NETHERLANDS/3/1999], A/mallard/Sweden/49/2002 [MA/SWEDEN/49/2002], A/mallard/Sweden/7/2002 [MA/SWEDEN/7/2002], and A/mallard/Sweden/21/2002 [MA/SWEDEN/21/2002]) and four viruses of poultry origin (A/turkey/Wisconsin/1968 [TU/WISCONSIN/1968], A/turkey/England/N28/1973 (TU/ENGLAND/N28/1973], A/turkey/Ireland/1983 [TU/IRELAND/1983], and A/chicken/Mexico/23294/1994 [CH/Mexico/23294/1994]). The other solid colors represent six H5N1 Guangdong lineage viruses (A/chicken/Hong Kong/220/1997 [CH/HK/220/1997], A/chicken/Legok/2003 [CH/LEGOK/2003], A/Vietnam/1203/2004 [VN/1203/04], A/chicken/West Java/SMI-HAMD/06 [SMI-HAMD/06], A/chicken/Papua/TA5/06 [Papua/06], and A/chicken/West Java/PWT-WIJ/06 [PWT/06]). Since the relative positions of antigens and antisera are determined and both the vertical and horizontal axes represent antigenic distance, the orientation of the map within these axes is free. The spacing between grid lines is 1 unit of antigenic distance, corresponding to a 2-fold dilution of antiserum in the HI assay.

