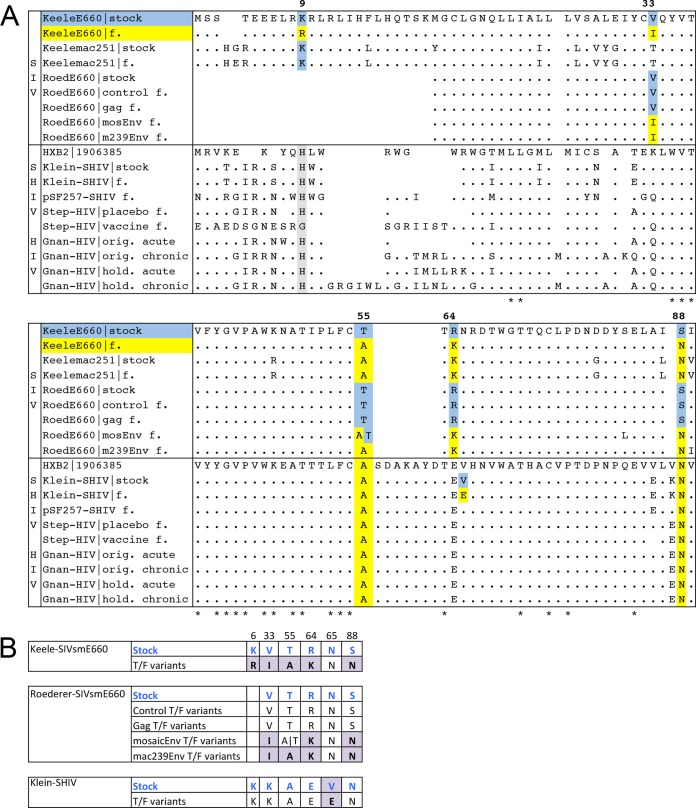
FIG 2.
Alignment of sequence variants in the present study showing the signature sites. For concise illustration, the figure uses a single consensus sequence to represent either the stock or T/F variants in the given dataset. Our statistical analyses were not based on consensus sequences except to deduce the T/F variants, i.e., we examined all variants in each stock and one T/F variant per infected animal, as described in Materials and Methods. (A) An alignment showing the signal peptide (where available) and the C1 region of gp120 for stock and T/F variants in the various datasets examined by this study. Signature sites were defined as sites where the residue preference of T/F variants was significantly different (based on a Fisher exact test) from the corresponding residue in the stock. The alignment shows signature sites at positions 9, 33, 55, 64, and 88 in SIV and site 65 in SHIV. HXB2 was added to the alignment for reference purposes, standardizing the coordinates across datasets. Residues in blue mark variants carrying the predominant stock residue, whereas yellow highlighting shows residues preferred by T/F viruses. The sites in gray show Gnanakaran et al.'s H12 site (H9 in our coordinates) proposed as a signature of acute viruses. Abbreviations and symbols: spaces represent gaps; f, T/F viruses; *, sites conserved across all datasets; ·, residues identical to those in the SIV or HIV variant at the top, i.e., the Keele-SIV stock or the HXB2 sequence. For visual clarity, residues at the signature sites are shown explicitly rather than using dots. (B) An abbreviated alignment showing only the columns for the six signature sites as seen in the experimental datasets. The alignment is grouped by dataset and depicts stock residues in blue and T/F residues in purple.

