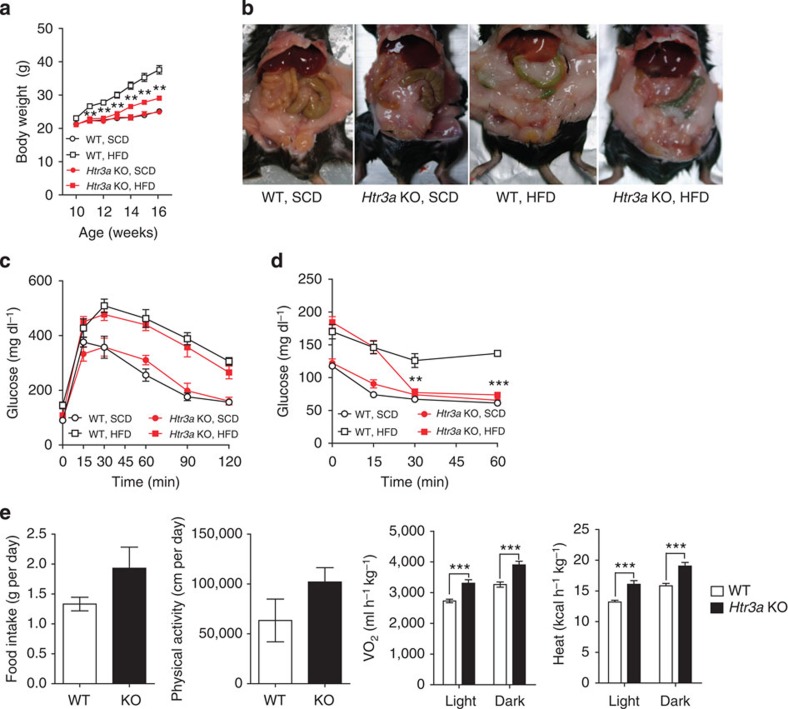
Figure 7. Htr3a KO mice are resistant to diet-induced obesity.
(a) Growth curves of Htr3a KO mice and their WT littermates fed an SCD or HFD. n=4 mice per group. **P<0.01 versus WT, HFD by Student's t-test. (b) Gross images of Htr3a KO mice fed an SCD or HFD for 6 weeks beginning at 8 weeks of age. (c) Intraperitoneal glucose tolerance test (IPGTT) after 16 h fasting. n=4 mice per group. (d) Intraperitoneal insulin tolerance test (IPITT) after 4 h fasting. n=4 mice per group. **P<0.01 and ***P<0.001 versus WT, HFD by Student's t-test. (e) The metabolic rates of Htr3a KO mice and their WT littermates after 6 weeks of HFD feeding. n=4 mice per group. ***P<0.001 versus WT by Student's t-test. All data are presented as the mean±s.e.

