
FIG 1.
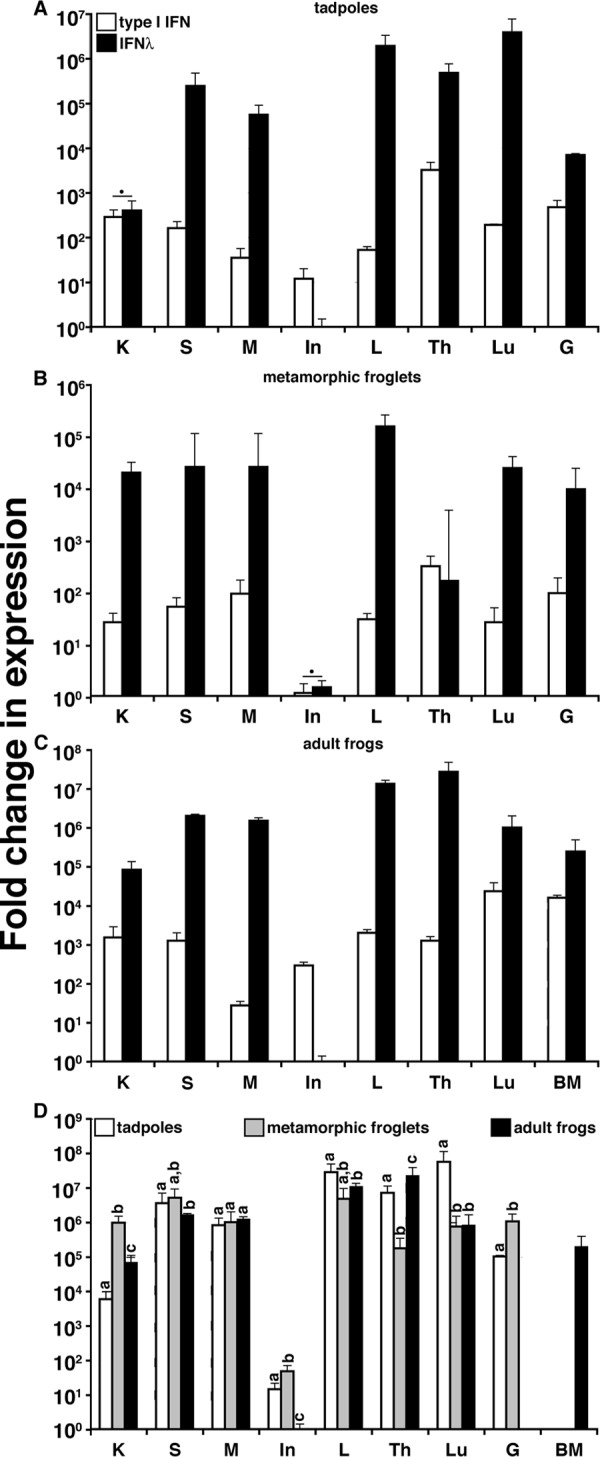
Analysis of X. laevis type I and type III IFN gene expression in tissue. Fold change in IFN expression in tadpoles (stage 54) (A), metamorphic froglets (stage 64) (B), and adult frogs (2 years old) (C) was determined. (D) Comparison of IFN-λ gene expression in tissue of premetamorphic, metamorphic, and postmetamorphic X. laevis. Tissues from three individuals of each stage were examined (n = 3). Letters at the top of the bars indicate tissues exhibiting significantly different (P < 0.05) gene expression levels. IFN-λ gene expression was significantly greater for all tissues with the exception of those marked with a filled circle (P < 0.05). Gene expression was examined relative to the level of the GAPDH endogenous control, and all results are depicted as means ± standard errors of the means. K, kidney; S, spleen; M, muscle; In, intestine; L, liver; Th, thymus; Lu, lung; G, gill; BM, bone marrow.