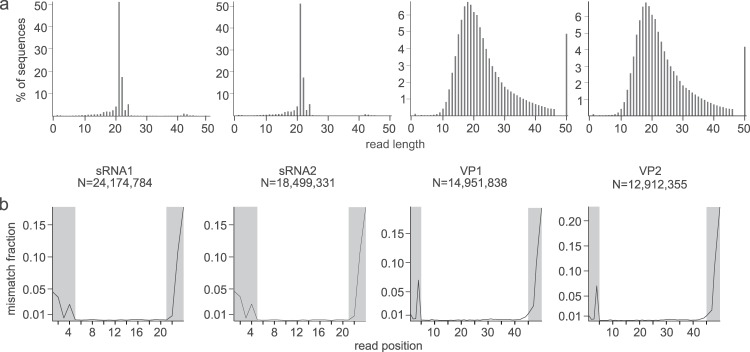
FIG 2.

Read length profiles, mismatch fractions per read position, and read trimming. (a) Total number of reads and read length profiles for each of the samples. (b) Relative frequencies of mismatches per position in the read after the test mapping. The higher mismatch frequencies observed at the 5′ and 3′ ends of the reads were trimmed (the positions shaded in gray) and were not used for subsequent SNP calling.
