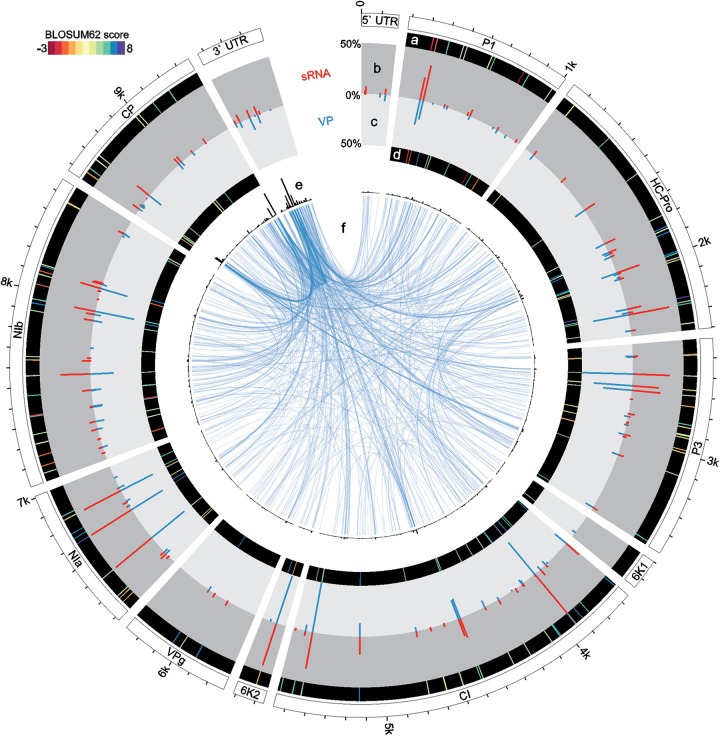
FIG 5.
Circular representation of PVY genome with plotted frequencies of SNPs in the sRNA and VP pools, corresponding BLOSUM62 amino acid substitution scores, and recombination points detected by ViReMa (only for the VP pool). (a) BLOSUM62 scores for amino acid changes corresponding to SNPs in the sRNA pool. (b) Square-root-transformed relative frequencies of SNPs detected in the sRNA pool. (c) Square-root-transformed relative frequencies of SNPs detected in the VP pool. (d) BLOSUM62 scores for amino acid changes corresponding to SNPs in the VP pool. (e) Histogram of frequencies of recombination points in 10-nt windows across the PVY genome (scale maximum is 380 events). (f) Visualization of recombination breakpoints detected in the VP pool. The link connects the 3′ and 5′ recombination breakpoint, and its thickness corresponds to the frequency of the event.

