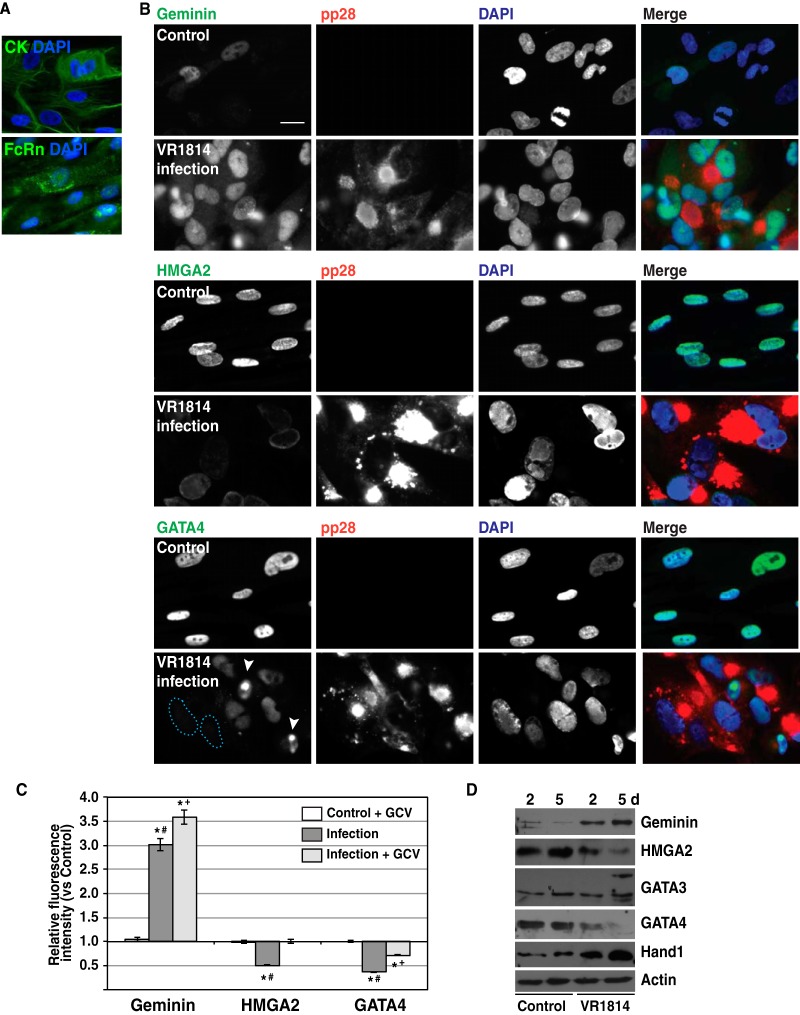
FIG 2.
HCMV infection of TBPCs alters expression levels of key regulatory proteins. (A) TBPCs express trophoblast-specific cytokeratins (CK) and neonatal Fc receptor (FcRn). Original magnification, ×200. (B) TBPCs were mock infected (control) or infected with HCMV strain VR1814 and fixed at 5 days p.i. The cells were immunostained for specific regulatory proteins (green) and HCMV pp28 (red) and counterstained with DAPI (blue). Colocalization of green and blue signals (turquoise) and of red and green signals (yellow) is shown. Original magnification, ×200. Bar = 20 μm. (C) Fluorescence intensities of geminin, HMGA2, and GATA4 were quantified using NIH ImageJ software. In each experiment, the mean intensities of ganciclovir (GCV)-treated uninfected control cells, infected cells, and infected, GCV-treated cells were normalized to the mean intensities of the control cells. Graphs show representative relative fluorescence intensity (mean ± SE) from 1 of 3 independent experiments. Significant differences were found by the Mann-Whitney rank sum test and indicated as follows: *, P < 0.0001 for mock-infected control cells and infected cells; #, P < 0.0001 for infected cells and infected, GCV-treated cells; and +, P < 0.0001 for GCV-treated mock-infected control cells and GCV-treated, infected cells. Significant differences indicated here for one experiment were found in all experiments. (D) Immunoblotting of key regulatory proteins. Cell lysates from control or infected TBPCs at 2 and 5 days (d) p.i. were immunoblotted with antibodies to TBPC regulatory proteins and actin (loading control).

