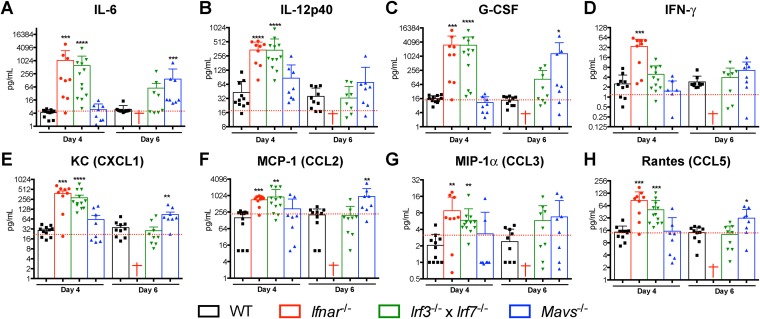
FIG 5.
Serum cytokine and chemokine levels in OROV-infected mice. WT, Ifnar−/−, Irf3−/− × Irf7−/−, and Mavs−/− mice were infected with 106 FFU of OROV. Four or 6 days later, serum was collected and the concentrations of the indicated cytokines (A to D) or chemokines (E to H) were determined by Bio-Plex assay. Data points represent individual mice, and the bars indicate the mean values ± standard deviations (SD) for each group. A red cross indicates that all OROV-infected Ifnar−/− animals were dead at the indicated time point. Asterisks indicate statistical significance compared to serum from OROV-infected WT mice as judged by the Mann-Whitney test (*, P < 0.05; **, P < 0.01; ***, P < 0.001; ****, P < 0.0001). The red dotted lines represent the mean values from three mock-infected mice for each analyzed cytokine.

