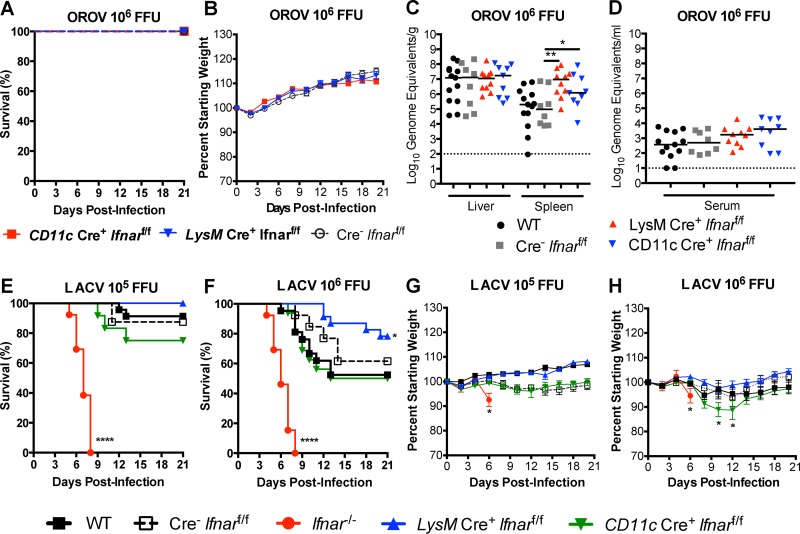
FIG 8.
LysM Cre+ Ifnarf/f and CD11c Cre+ Ifnarf/f are not more vulnerable to OROV and LACV infection. (A) Survival analysis of 5- to 6-week-old mice after inoculation with 106 FFU of OROV by footpad injection: CD11c Cre+ Ifnarf/f (n = 30), LysM Cre+ Ifnarf/f (n = 25), and Cre− Ifnarf/f (n = 31) mice were used to construct survival curves. Data are pooled from at least three independent experiments. (B) Weight loss in CD11c Cre+ Ifnarf/f (n = 30), LysM Cre+ Ifnarf/f (n = 25), and Cre− Ifnarf/f (n = 31) mice. The weight loss curves were compared at a given time point using 2-way ANOVA. (C and D) Quantification of OROV RNA by qRT-PCR in the liver (C), spleen (C), and serum (D) from WT, CD11c Cre+ Ifnarf/f, LysM Cre+ Ifnarf/f, and Cre− Ifnarf/f mice at 4 days after infection. A scatter plot of the data is shown, with each point representing a single animal. The bars indicate median values and were obtained from 10 mice per group. The dotted line represents the limit of detection of the assay. Groups were compared to the WT by the Mann-Whitney test; asterisks indicate statistically significant differences (*, P < 0.05; **, P < 0.01). Note, OROV RNA was detected in the serum, spleen, and liver of WT mice by qRT-PCR, as this assay was more sensitive than infectious virus titration (Fig. 2) or IHC (Fig. 4). (E and F) Survival analysis of 8-week-old mice after inoculation with 105 FFU (n = 23 for WT, n = 5 for Ifnar−/−, n = 25 for LysM Cre+ Ifnarf/f, n = 12 for CD11c Cre+ Ifnarf/f, and n = 8 for Cre− Ifnarf/f) (E) or 106 FFU (n = 21 for WT, n = 5 for Ifnar−/−, n = 23 for LysM Cre+ Ifnarf/f, n = 16 for CD11c Cre+ Ifnarf/f, and n = 13 for Cre− Ifnarf/f) (F) of LACV by footpad injection. (G and H) Weight loss analysis of 8-week-old mice after inoculation with 105 FFU (G) or 106 FFU (H) of LACV by footpad injection in the same mice. Data are pooled from at least three independent experiments. Survival curves were analyzed by the log rank test, and weight loss values were compared by 2-way ANOVA. Asterisks indicate differences that were statistically significant compared to WT animals with the same viral dose (*, P < 0.05).

