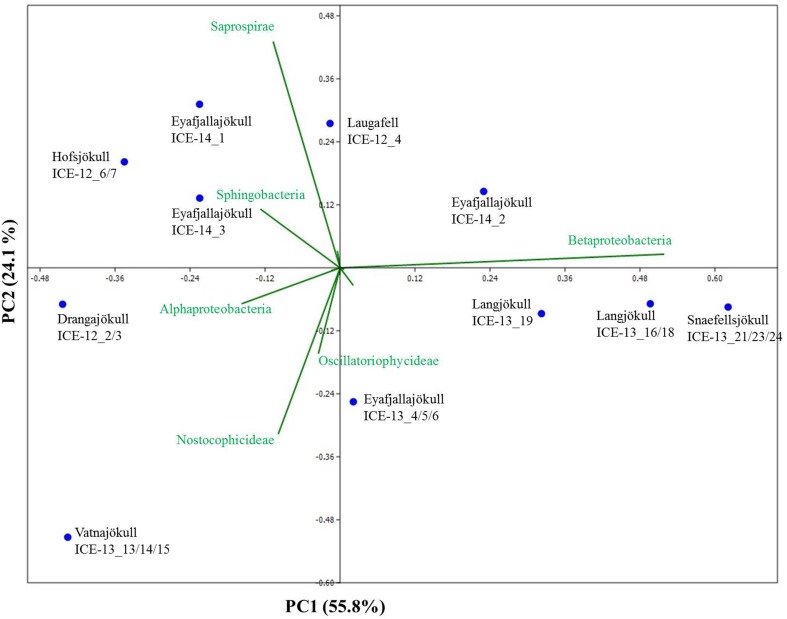
Figure 7.
Principal component analysis of bacterial species revealing taxonomic distance between sampling sites and species causing separation. Samples collected in 2012 and 2014 cluster together due to a higher relative abundance of Bacteriodetes (Sphingobacteria, Saprospirae), whereas samples collected in 2013 contain higher proportions of Betaproteobacteria and Cyanobacteria (Nostocophicidae, Oscillatoriophycideae).

