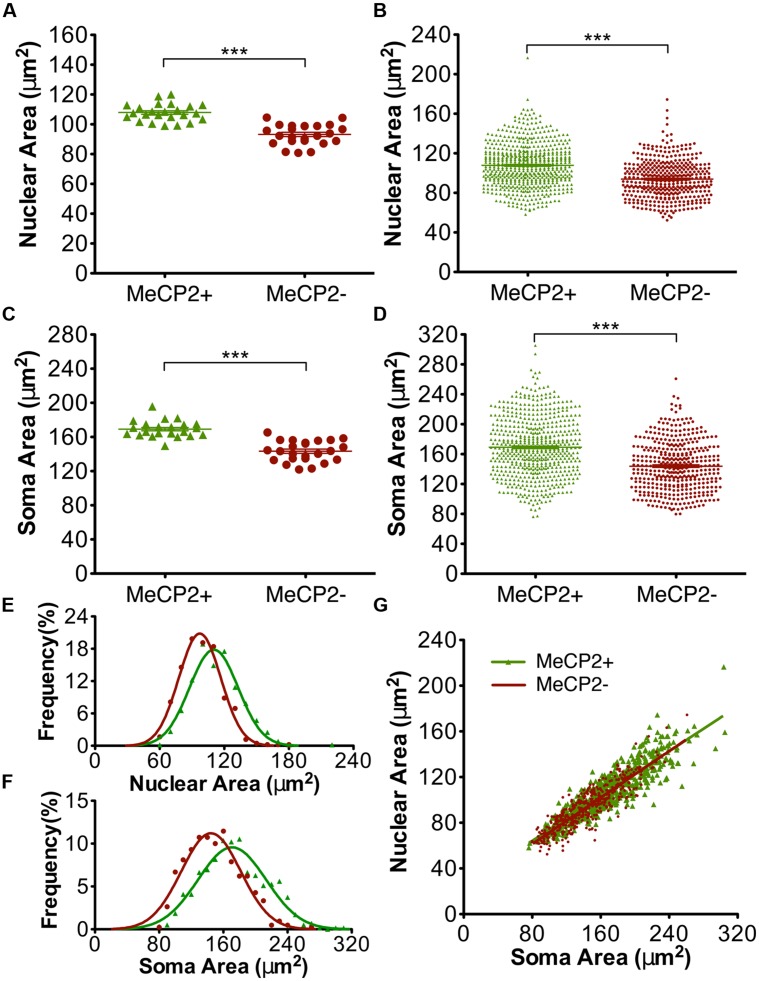
FIGURE 7.
MeCP2- neurons have smaller somata and nuclei than MeCP2+ neurons. MeCP2- nuclei (A) and somata (C) are on average 13 and 15% smaller than MeCP2+ nuclei and somata, respectively (n = 24 animals). The population of MeCP2- nuclei (B) and somata (D) have fewer large nuclei and somata compared to MeCP2+ (MeCP2+ n = 598 cells and MeCP2- n = 418 cells). Frequency distributions of nuclear (E) and soma (F) areas are significantly different between the genotypes (p < 0.0001, nuclear area MeCP2+ R2 = 0.96 and MeCP2-R2 = 0.98; Soma area MeCP2+ R2 = 0.93 and MeCP2-R2 = 0.94). (G) Soma area is a predictor of nuclear area in both genotypes. Slopes are equal between the genotypes (p = 0.30, MeCP2+ R2 = 0.79 and MeCP2- R2 = 0.78). ∗∗∗p < 0.001.

