Table 1.
The oriC information of some representative bacterial chromosomes with putative double origins of replication in DoriC.
| Organism | Refseq | Location | Adjacent gene | No. of DnaA boxesa | Z-curvesb |
|---|---|---|---|---|---|
| Acidaminococcus fermentans DSM 20731 | NC_013740 | 2540..2750 nt and 4140..4386 nt (oriC 1) 2329473..33 nt and 1195..1915 nt (oriC 2) | dnaA (2751..4139 nt; oriC 1) dnaA (34..1194 nt; oriC 2) | 13 (oriC 1) 20 (oriC 2) |
 |
| Dehalobacter sp. CF | NC_018867 | 3091418..3092048 nt (oriC 1) 150334..150923 nt (oriC 2) | dnaA (1..1338 nt; oriC 1) parB (149395..150333 nt; oriC 2) | 4 (oriC 1) 3 (oriC 2) |
 |
| Ralstonia pickettii 12D chromosome 1 | NC_012856 | 3356072..3356652 nt (oriC 1) 3647708..612 nt (oriC 2) | hemE (3356653..3357756 nt; oriC 1) dnaA (613..2202 nt; oriC 2) | 3 (oriC 1) 3 (oriC 2) |
 |
| Ochrobactrum anthropi ATCC 49188 chromosome 1 | NC_009667 | 544..1438 nt (oriC 1) 883808..884261 nt (oriC 2) | dnaA (1439..3001 nt; oriC 1) hemE (884262..885287 nt; oriC 2) | 3 (oriC 1) 3 (oriC 2) |
 |
Note that only the E. coli perfect DnaA box (TTATCCACA) was considered with no more than one mismatch.
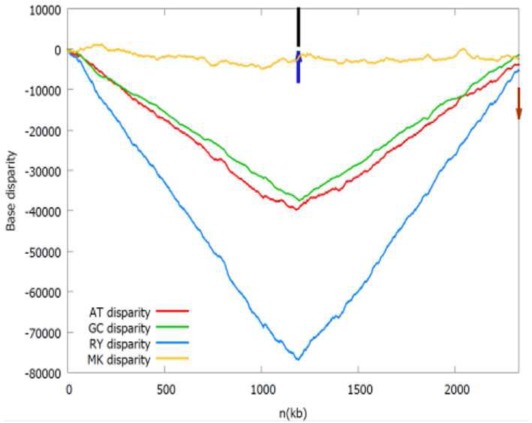
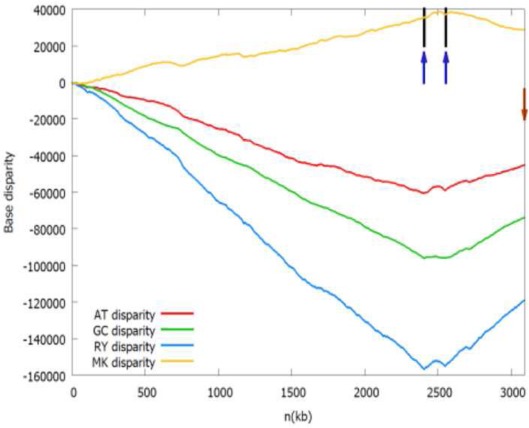
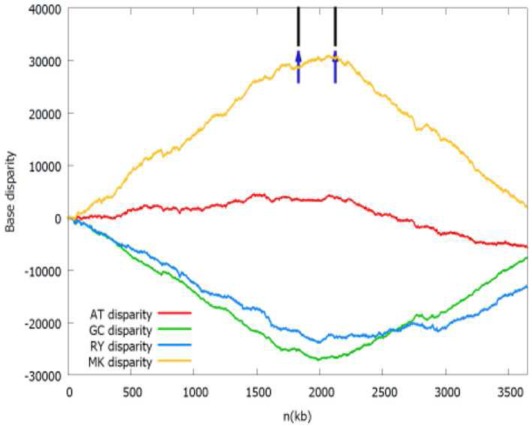
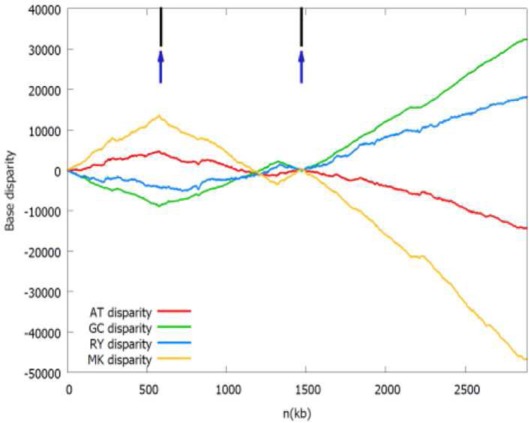
The Z-curves (that is, RY, MK, AT, and GC disparity curves) are plotted for the rotated sequence beginning and ending in dif site or the maximum of the GC disparity curve. Short vertical black line indicates the location of the adjacent gene listed in the table, while short up vertical dark blue arrow indicates the location of the identified oriC (note that the left arrow indicates oriC 1 and the right arrow indicates oriC 2) and short down vertical brown arrow indicates dif site location, if any. It should be noted that both the black lines and dark blue arrows in the first panel (Acidaminococcus fermentans) are located too close together to be drawn individually.
