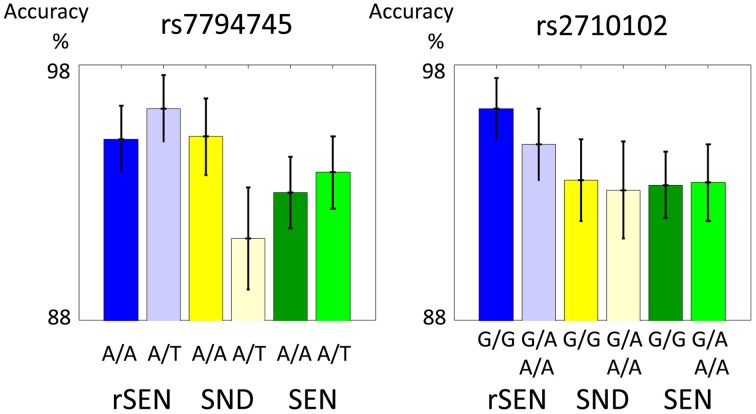
Figure 2.
Performance during fMRI experiments. These two figures show the distribution of fMRI performance in rs7794745 (left side) and rs2710102 (right side) of CNTNAP2 gene. In both SNPs, there were no significant differences in the performance of rSEN, SND, and SEN (p > 0.05). (1) rSEN: rs7794745 A/A: blue bar, rs7794745 A/T: light blue bar, (2) SND: rs7794745 A/A: yellow bar, rs7794745 A/T: light yellow bar, (3) SEN: rs7794745 A/A: green bar, rs7794745 A/T: light green bar, (4) rSEN: rs2710102 G/G: blue bar, rs2710102 G/A and A/A: light blue bar, (5) SND: rs2710102 G/G: yellow bar, rs2710102 G/A and A/A: light yellow bar, (6) SEN: rs2710102 G/G: green bar, rs2710102 G/A and A/A: light green bar.

