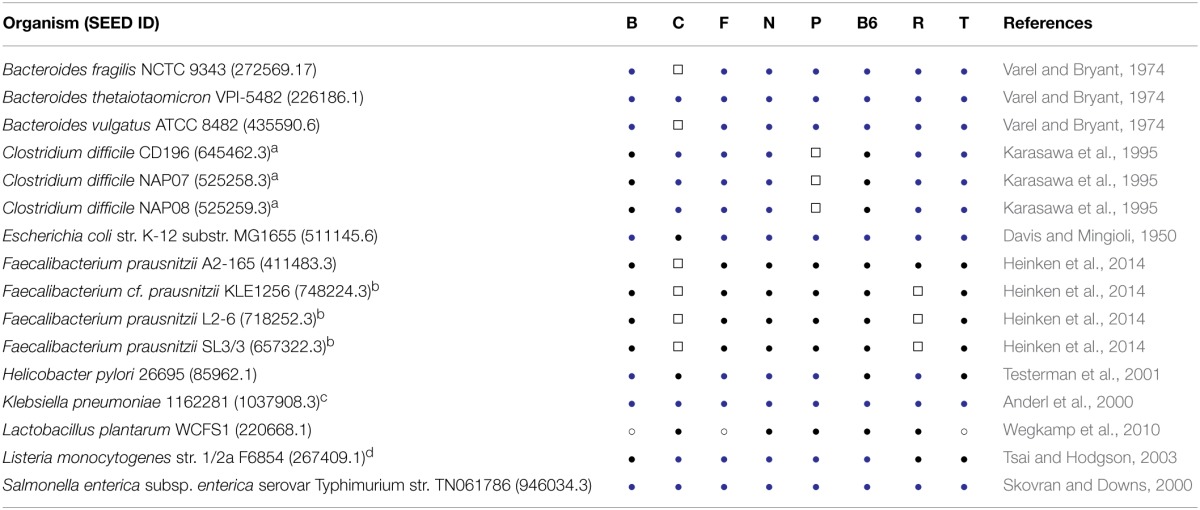
Table 4.
Comparison of genomic predictions and experimental evidence.

B, biotin, C, cobalamin, F, folate, N, niacin, P, pantothenate, B6, pyridoxine, R, riboflavin, T, thiamin. Filled circles represent agreeing predictions and data, empty shapes represent mismatches.  , predicted producers, ●, predicted non-producers, □, predicted producers, ◦, predicted non-producers. Footnotes list the comparative strain in the cases where the predicted and experimental strains are different.
aC. difficile VPI 10463, KZ 1626, KZ 1630, KZ 1647, and KZ 1748.
bF. prausnitzii A2-165.
cK. pneumonia Kp1 and Kp102M.
dL. monocytogenes 10403, EGD-e, and L028.
