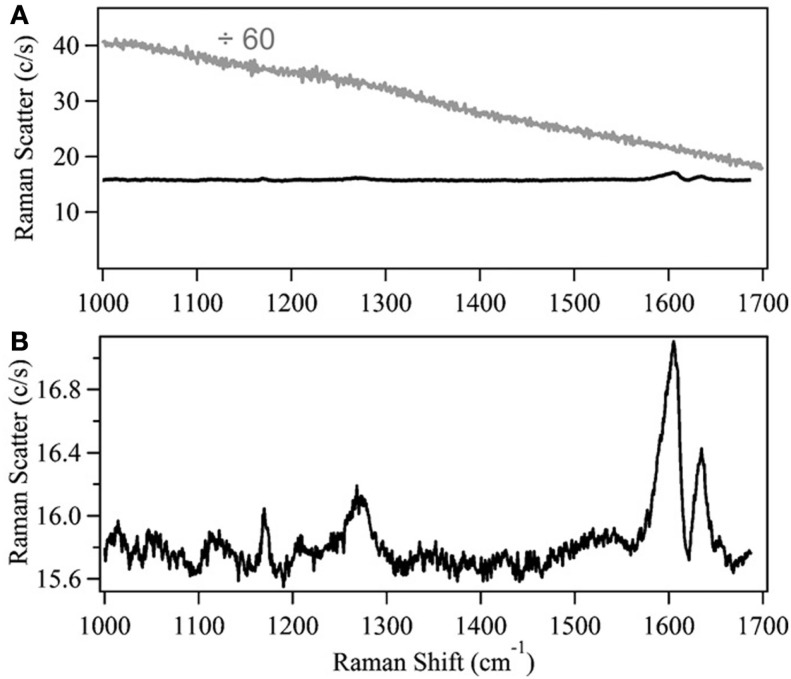
Figure 3.
Comparison of 785 and 1064 nm excitation wavelengths to evaluate lignin. (A) Background-subtracted Raman spectra of 50 mg/mL lignin, dissolved in methanol, obtained using a dispersive 785 nm (gray) or 1064 nm (black) spectrometer. The 785 nm excitation spectrum has been divided by 60. (B) The 1064 nm excitation lignin spectrum, plotted on a smaller scale to elucidate spectral features [reprinted with permission from Elsevier, Meyer et al. (2011)].

