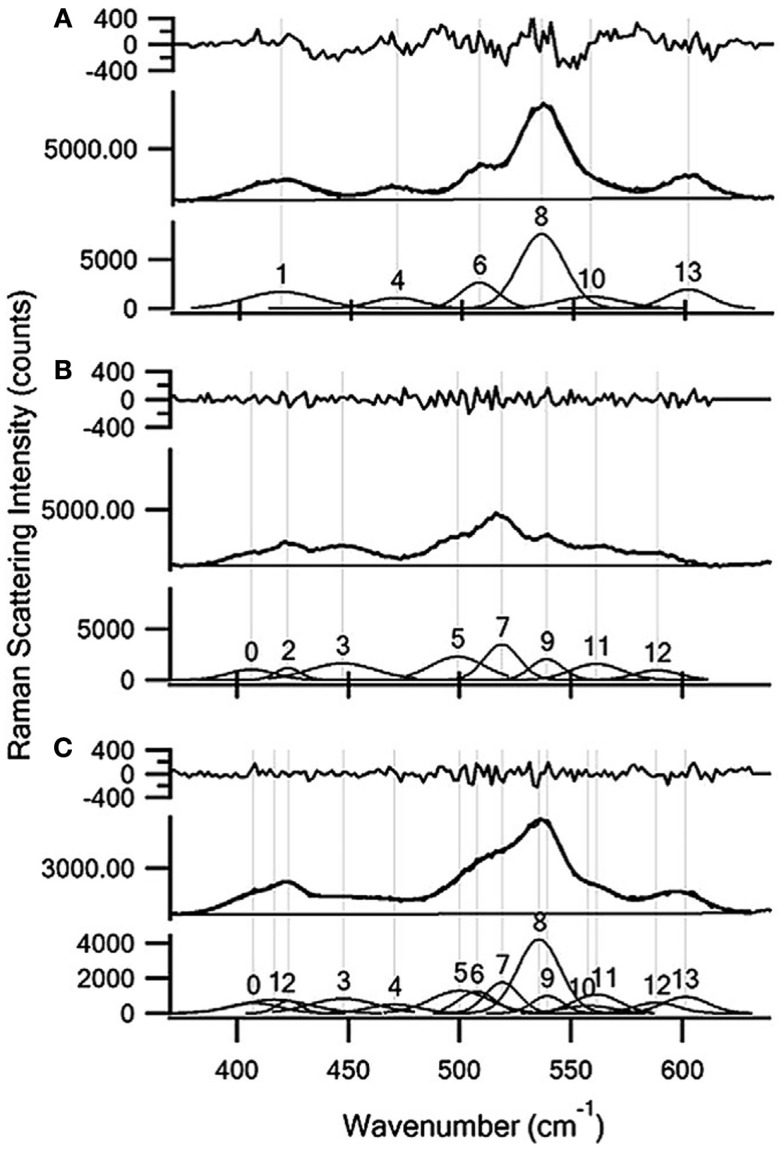
Figure 4.
Multi-peak curve fitting results for (A) 100 mg/mL xylose; (B) 120 mg/mL glucose; and (C) a 60 mg/mL glucose and 50 mg/mL xylose mixture in a soaking in aqueous ammonia hydrolysis broth. The residual between the multi-peak fit and the experimental data is shown in the top panel. The residual is of the same order of magnitude as the spectral noise. The experimental spectra are shown in the middle panel (thicker line) and the fit results are shown in the bottom panel (thinner line) [reprinted with permission from Elsevier, Shih et al. (2011)].

