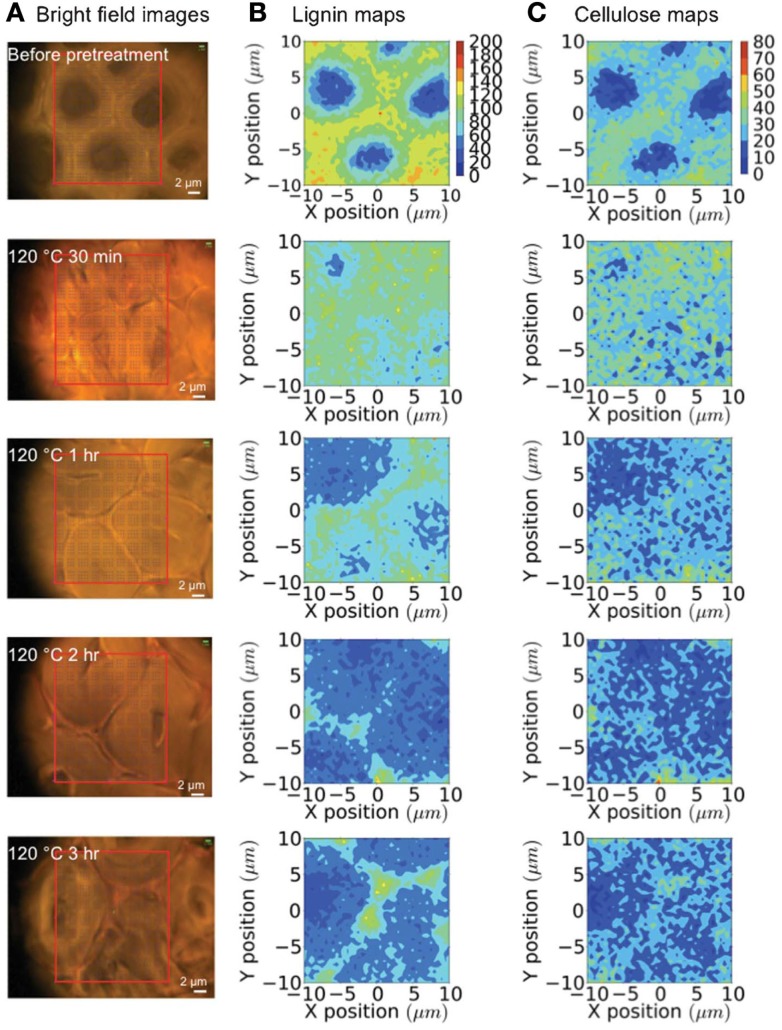
Figure 7.
Raman mapping of sclerenchyma cells during an ionic liquid pretreatment. (A) Bright-field microscopy images; (B) lignin maps (black boxes are the locations of cell corners); and (C) cellulose maps generated over 0–3 h of pretreatment [reprinted with permission from the Royal Society of Chemistry, Sun et al. (2013)].

